


- Bitcoin’s ascent to $60K has yet to trigger a significant rally among altcoins, indicating a potential consolidation phase ahead.
- Glassnode reports Bitcoin’s realized cap nearly reaching an all-time high, signaling a robust recovery in market valuation.
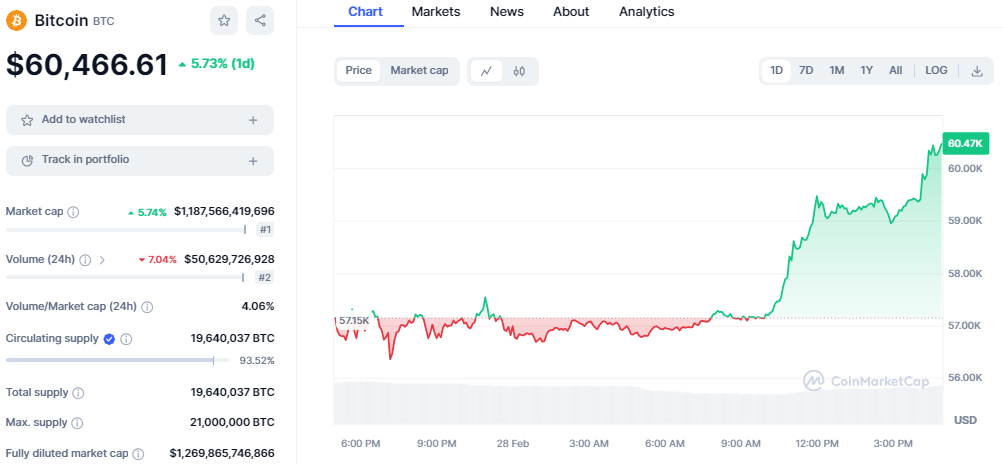
- Bitcoin’s surge past $60k, marking over 5% daily and 18% weekly gains, signals strong bullish momentum despite extreme greed in the market.
Bitcoin has recently approached the $60,000 mark, an event that has captured the crypto community’s attention. However, this milestone has not sparked the expected widespread euphoria, as most altcoins remain stagnant. This situation closely mirrors the Bitcoin Dominance (BTC.D) chart, which provides a clear overview of Bitcoin’s current market dominance relative to altcoins.
AltcoinSherpa, a crypto analyst, shared insights about Bitcoin’s nearing historic highs amid the quiet Altcoin market.
Moreover, the altcoin sector is struggling to find its footing. The explosive gains seen in 2021, where numerous altcoins surged by 30% daily, seem distant as the market dynamics have shifted. Currently, altcoins are battling for breathing space, hindered by Bitcoin’s dominant market performance. This has led to expectations of further consolidation and range-bound trading among these digital assets in the medium term.
Despite the broader market’s subdued response, certain sectors within the cryptocurrency space are experiencing notable activity. Meme-themed cryptocurrencies, in particular, have seen an uptick in interest and valuation. This movement suggests that while the overall market may be in a period of consolidation, there are still opportunities for investors willing to explore niche sectors.
Adding to the market analysis, Glassnode, a leading provider of onchain and financial metrics, has shared critical data regarding Bitcoin’s performance. According to Glassnode, following a week of explosive price action and strong capital inflows, Bitcoin’s Realized Cap has nearly fully recovered, reaching a value of $467.2 billion. This figure is just 0.22% shy of the all-time high (ATH) of $468.3 billion, underscoring the robust recovery and resilience of Bitcoin in the current market environment.
As of this writing, BTC is exhibiting a bullish trend as the price rallies to $60,466. After BTC traded in a tight range between the $57k level yesterday, a break above the $60k mark has been achieved today. Today’s surge displays an increase of over 5% and 18% on the daily and weekly charts, respectively. However, traders should take caution about the current market situation as the Fear and Greed Index climbs to 82, suggesting Extreme Greed.
The analysis of the Bollinger Band indicator on the daily chart further supports Bitcoin’s bullish outlook, which points to a robust upward trend. The appearance of increasing green candlesticks underscores the momentum on the buyer’s side. With the bands set at an upper boundary of $57,670 and a lower one at $45,930, it signals both volatility and the possibility for future growth.
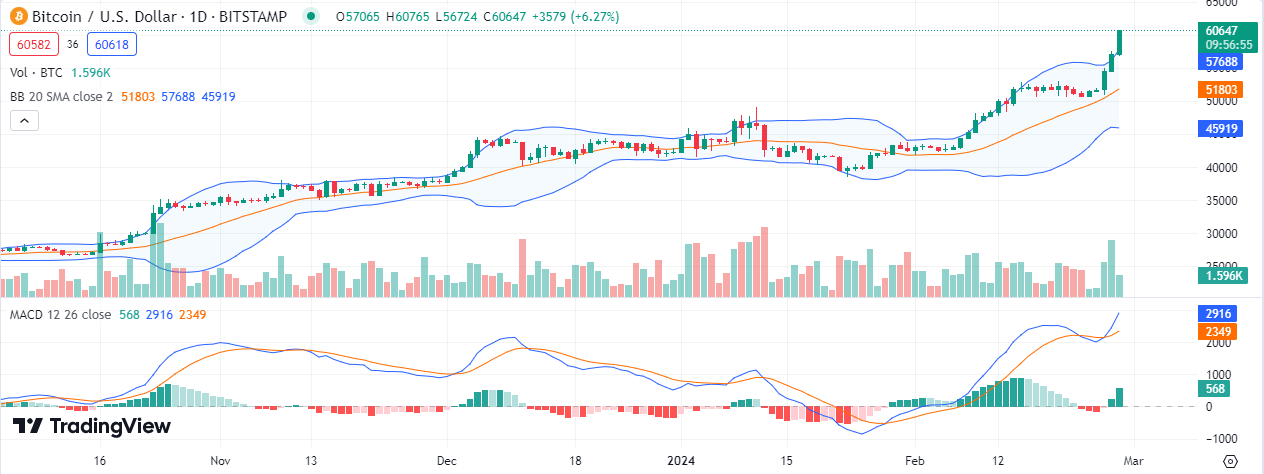
Additionally, the Moving Average Convergence Divergence (MACD) indicator is firmly within bullish territory, as evidenced by the signal line moving above the MACD line. This is further accentuated by the histogram’s transition from red to green bars, signifying a rise in positive market momentum.


