- Injective grapples with persistent resistance at $42, with a potential breakout on the horizon, offering traders a critical setup for future movements.
- Ethereum Classic gains vitality due to Ethereum ETF speculation and is currently positioned at the 0.5 Fibonacci retracement level.
- Market conditions for $INJ and $ETC suggest impending decisive movements, emphasizing the significance of key support and resistance levels.
Injective (INJ) has consistently faced strong resistance at the $42 mark. Over the past week, this level has posed a significant challenge for the asset. Moreover, a subtle trendline support is emerging on the 1-hour chart, indicating a crucial juncture for Injective’s short-term trajectory.
CryptoBusy, a crypto analyst, shared a post on X emphasizing how $42 has proven to be a formidable resistance level for $INJ and pointed out the emergence of a subtle but significant trendline support on the 1-hour chart.
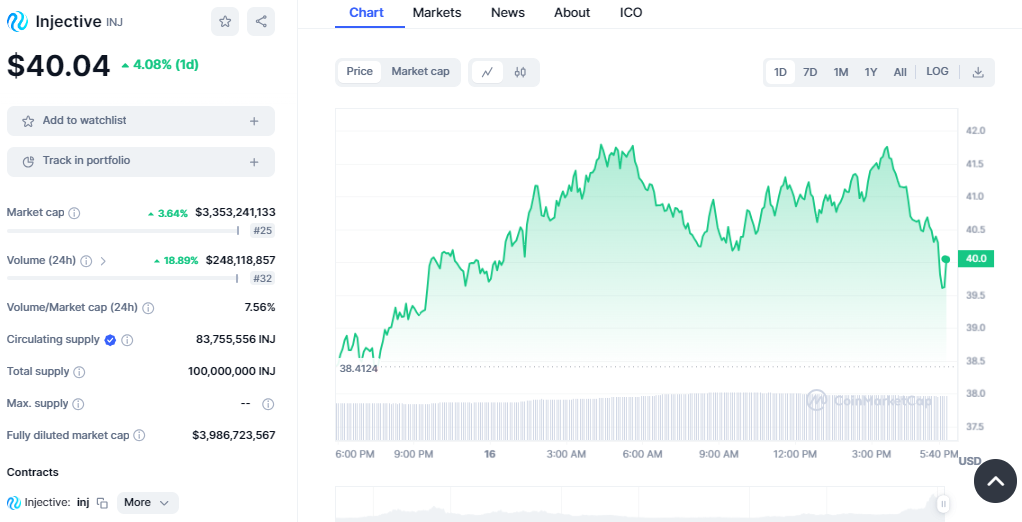
Currently, $INJ oscillates within a tight range, between $38 and $42. This trading range could be a critical setup for potential future movements. A decisive breakout beyond this zone could catalyze a momentum shift, potentially propelling Injective toward the $45 mark. This level is a monthly resistance, holding significant importance in the asset’s price dynamics.
The current market conditions suggest that Injective is on the cusp of a decisive movement. It’s important to note that the $35 level has consistently provided robust support. Significantly, a break above the $42 resistance or a dip below the $35 support could set the tone for the asset’s short-term performance. With these key levels in play, traders await a potential breakout that could define the next phase for Injective.
As of press time, INJ is trading on a bullish note as the price lies at $40.04, an increase of 4% from yesterday’s close of $39.75. INJ is forming higher highs and lows on the daily chart as the price hovers above the $40 mark. The bullish outlook has been supported by the rise in daily trading volume and the market cap. The daily trading volume has climbed to $248 million, while the market cap is at $3.35 billion.
Ethereum Classic has recently experienced a notable surge, primarily fueled by market chatter regarding a potential Ethereum ETF for ETH. This speculation has injected vitality into the ETC market, propelling it to an important juncture. Currently, Ethereum Classic finds itself at the 0.5 Fibonacci retracement level, a significant technical indicator for traders. Consequently, the market now stands at a crossroads, anticipating either a bounce back or a further breakdown from this crucial point.
In another tweet, CryptoBusy discussed ETC’s performance amid market speculation about a potential EthereumETF for $ETH.
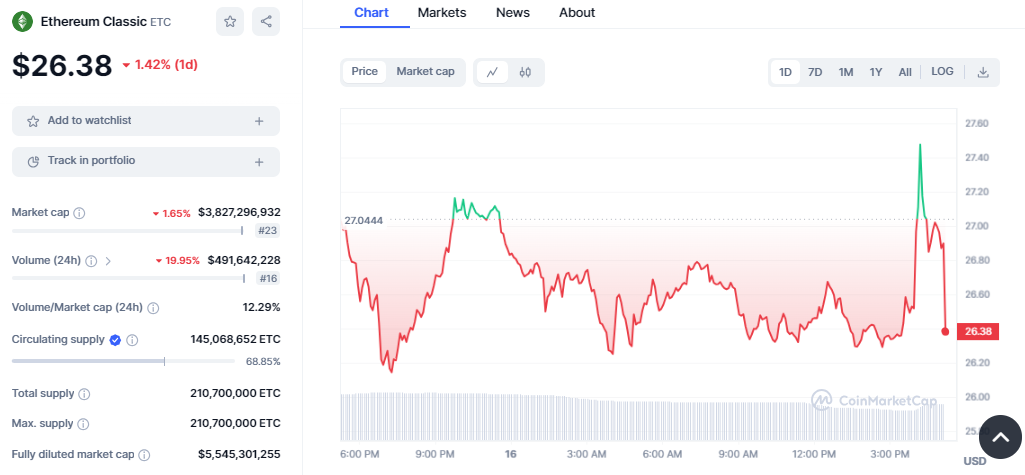
ETC is currently facing resistance at the $27.00 mark. This level represents a critical barrier the digital asset must overcome to maintain its upward trajectory. Additionally, a support level has formed around $26.00, as observed in the daily time frame chart. This support is key to ETC’s stability and could be significant in its short-term price movements.
Looking ahead on ETC’s market, the token has been trading in negative territory for most of the session. The bears have been persistent as ETC failed to surpass $27.50 when the bulls gained momentum and faced a pullback to $26.38, where it is currently trading. ETC’s market cap and 24-hour trading volume have faced a significant decline, too, dropping to $3.82 billion and $491 million, respectively.
In conclusion, Injective and Ethereum Classic are navigating crucial phases in their market trajectories. Injective, grappling with the $42 resistance level, shows signs of a potential breakout, while Ethereum Classic, influenced by ETF speculation, encounters another breakout or breakdown to follow. The market conditions in the coming days will likely be pivotal in determining the short-term direction of these assets.