
- ORDI’s price is currently forming a head and shoulders pattern, signaling a potential trend reversal in the cryptocurrency market.
- A possible trendline breakout adds to the intrigue, with ORDI’s price showing volatility.
- Technical indicators like RSI and moving averages provide valuable insights, but caution and vigilance are essential in the crypto realm.
In the fast-moving realm of cryptocurrencies, the spotlight falls upon ORDI, where a series of noteworthy developments are unfolding. Crypto enthusiasts and market participants are keenly observing this digital asset as it charts a course that could potentially result in gains or losses of up to 10%, contingent upon support and resistance levels.
A prominent figure in the cryptocurrency community, CryptoBusy, has recently issued an intense price update. The charts for ORDI are currently revealing the formation of a head and shoulders pattern on both the 1-hour and 4-hour timeframes. This technical pattern often serves as an indicator of a potential trend reversal, a fact that has generated considerable interest and speculation among traders and investors.
This pattern typically signals a potential reversal in the prevailing trend. The revelation has generated considerable attention and discussion within the cryptocurrency community as traders prepare for the ramifications of this technical formation.
However, amidst the anticipation surrounding the head and shoulders pattern, another intriguing element has come into focus: a possible trendline breakout. The cryptocurrency market is no stranger to the swift price movements that can result from such breakouts, and ORDI appears to be in a position that could trigger one.
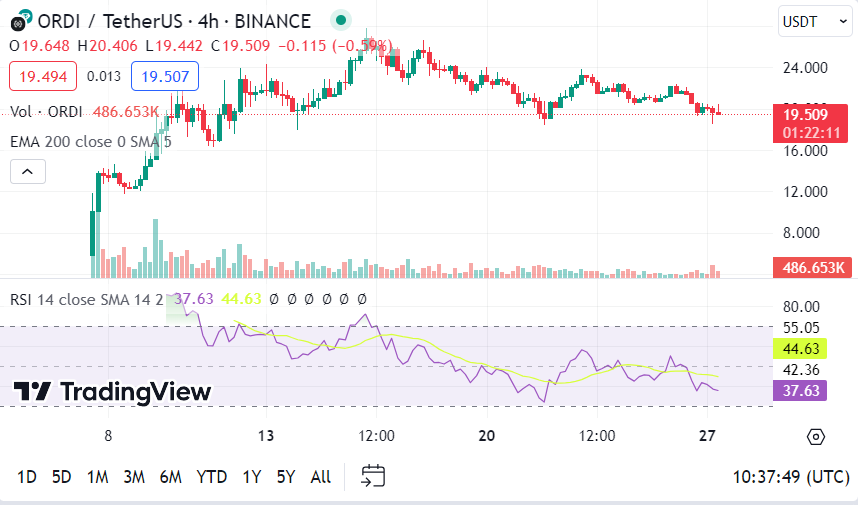
Currently, $ORDI is priced at $20.22, reflecting a 7.25% decrease in the last 24 hours and a more substantial 13.42% decline over the past week. In the cryptocurrency sphere, such price fluctuations are standard, given the prevalent volatility. With a circulating supply of 21 million $ORDI tokens, the market capitalization of this digital asset is estimated at $425 million.
As traders assess their positions and formulate strategies, technical indicators provide valuable insights. The Relative Strength Index (RSI) currently registers at 41.78, indicating that ORDI is presently not in an extreme overbought or oversold condition. This RSI reading suggests a relatively neutral stance, leaving room for potential price movements in either direction.
Furthermore, the 4-hour Know Sure Thing (KST) indicator reflects negative or bearish momentum at the present moment. Nevertheless, it’s essential to recognize that technical indicators offer snapshots of the prevailing market sentiment, subject to swift changes in response to new developments.
Regarding moving averages, the 50 Exponential Moving Average (EMA) presently exceeds the 100 EMA, hinting at a short-term trend that may be more robust or bullish than the longer-term trend. Traders frequently employ moving averages to gauge the direction of an asset’s price trajectory.
ORDI finds itself at a pivotal juncture, with traders and investors closely monitoring unfolding technical patterns and market indicators. The potential for both a head and shoulders pattern and a trendline breakout introduces an element of uncertainty.
As customary in the cryptocurrency realm, caution is advised. Setting up alerts on both trendlines and remaining informed about the latest developments within the crypto sphere is paramount. In this ever-evolving landscape, opportunities and risks abound, demanding a well-informed and strategic approach.