


- Floki’s price experienced significant drops over recent months, showing high volatility.
- Price points for Floki ranged from 0.00042000 USDT to 0.00008300 USDT.
- Recent trends suggest Floki might face further sharp declines in trading value.
According to crypto analyst CryptoBull77, Floki (FLOKI), a popular meme coin, has exhibited significant fluctuations in its trading behavior. The analysis underscores a trend of rapid price declines, pointing to a volatile period for the cryptocurrency.
Floki’s price trajectory has been marked by abrupt downturns in recent months. Recorded losses include sharp falls of 47.71% in March, 48.61% in early April, and 49.95% later that month.
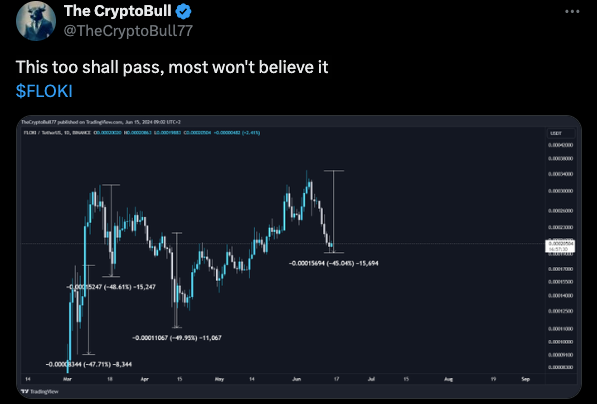
The trend continued into June with a 45.04% decline, underlining the unpredictable nature of meme coin investments. Each price drop has been characterized by swift sell-offs, briefly interrupted by minor recoveries, only to decline again.
This pattern underscores the high-risk environment of trading Floki, with prices swinging from a high of 0.00042000 USDT to a low of 0.00008300 USDT. Such dramatic fluctuations are typical of meme coins, which often experience wide-ranging volatility based on market sentiment and investor reactions.
Analyst Predicts Bearish Trends for PEPE, SHIB, and FLOKI Amid Market SlumpOver the past 24 hours, Floki’s price experienced a notable decline. The cryptocurrency began a downward trajectory, culminating in a current price of $0.0001917. This represents a 4.80% drop within a single day.
Floki’s market capitalization also reflected this decrease, shrinking by 4.81% to reach approximately $1.83 billion. However, despite the price dip, trading activity has surged. The 24-hour trading volume soared by 23.18%, amounting to over $210 million. This increase in volume suggests a heightened level of investor activity.
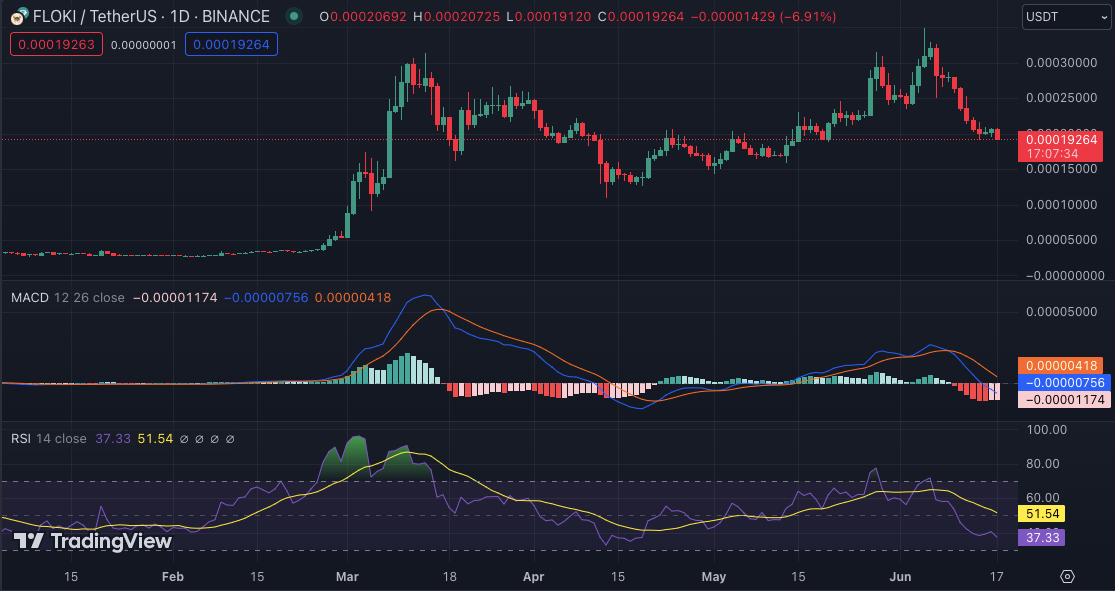
The 24-hour technical indicators for Floki hint at potential shifts in market sentiment. The Moving Average Convergence Divergence (MACD) reveals a bearish crossover as the signal line surpasses the MACD line, a hint that selling momentum may be strengthening.
The Relative Strength Index (RSI) stands at 37, hovering below the midpoint of 50, which indicates a neutral market condition moving towards the oversold region. This level indicates neither an overbought nor an oversold condition.


