Solana, a layer 1 cryptocurrency, has reached the $127.73 price point 15 times in the last four months. A crypto analyst from Invest Answers shared Solana’s chart showcasing these recurring price points.
This emphasizes the sharp fluctuations in Solana’s price, with both declines and rebounds. This frequent return to the $127.73 level suggests it is a significant pivot point for the cryptocurrency. This indicates a strong market reaction through concentrated buying or selling.
In another recent X post, crypto analyst Mert shared insights on Solana’s (SOL) market dynamics. Mert elucidated that the apparent downtrend in SOL’s price isn’t a natural market movement but a manipulation tactic.
According to Mert, large-scale investors, often called ‘whales,’ actively place deceptive sell orders on various exchanges. This strategy, known as ‘spoofing,’ is intended to create a false impression of a price drop. Consequently, inexperienced traders and risk managers sell their holdings, hoping to buy back at lower prices.
SEC Keeps Solana’s Security Status Uncertain Amid Binance Lawsuit AdjustmentsDuring reporting, Solana experienced a notable dip of 17.43% of its value from the previous day. As of press time, it stood at $118.46. The sharp decline reflects broader market trends and has notably impacted Solana’s market position.
The cryptocurrency’s trading volume surged 145% within the same period, totalling $8,275,391,987. This spike in volume coincides with the significant price reduction, indicating heightened market activity as investors react to the price movements. Solana’s market capitalization now stands at approximately $55.14 billion, marking an 18.11% decrease, aligning with the price downturn.
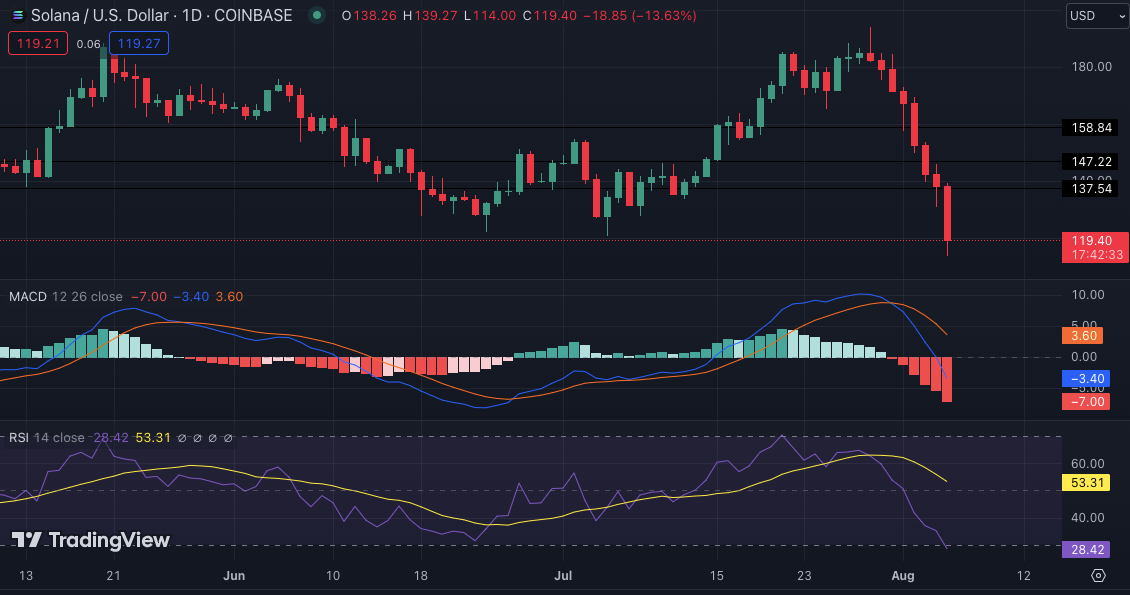
The 24-hour technical indicators for Solana show bearish signals on the daily chart. The Moving Average Convergence Divergence (MACD) reveals a deepening downtrend trend. The MACD line crossing below the signal line is an indicator that suggests an increasing selling pressure. The Relative Strength Index (RSI) is at 28.42, which is below the neutral 30 mark, suggesting an oversold condition.