- XRP is on the verge of a significant price movement, with the Multi-Year Ascending Trend Line playing a pivotal role.
- The MACD indicator shows bullish signals, with a positive histogram and a crossover of the MACD line above the signal line.
- Traders are urged to exercise caution and readiness for a potential price correction amidst the brewing excitement.
XRP is showing promising signs in the monthly time frame. Bullish sentiments are rising among traders and investors, with anticipation building for a potential price surge. However, caution is advised, as a brief downward correction may rattle the nerves of the faint-hearted.
In a recent analysis, market expert Egrag Crypto shared insights on XRP, highlighting a strong upward trend on its monthly chart. He emphasized that the asset is gearing up for a significant increase.
The Multi-Year Ascending Trend Line is the line in focus here. If XRP manages to break out above this critical level, it could set the stage for a remarkable ascent, potentially reaching the $2.0 mark. However, investors must be prepared for the possibility of a breakdown, which could see XRP retracing back to $0.2.
To gauge the potential pump, analyst Egrag Crypto stated that traders should closely be watching the Moving Average Convergence Divergence (MACD) indicator. The MACD has formed a bullish pennant, signaling optimism in the market. The histogram has turned positive, with green bars emerging, and the MACD line has crossed above the signal line.
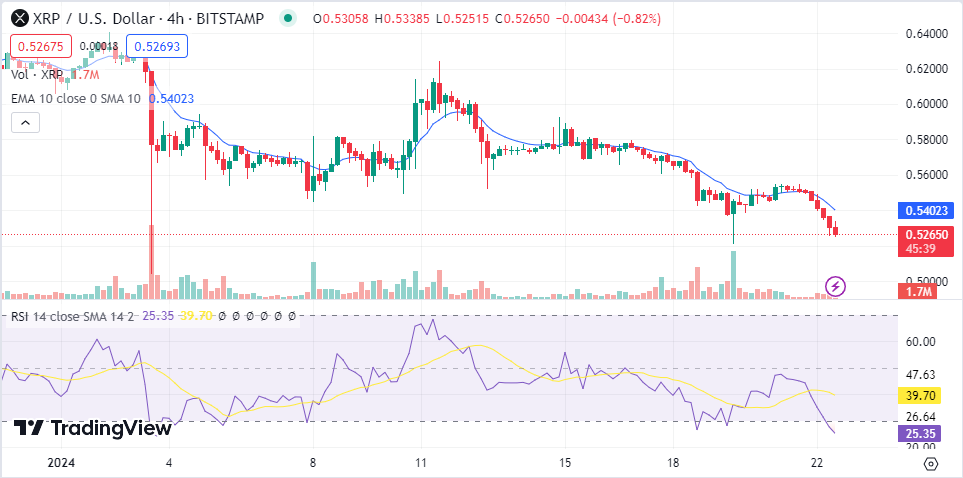
Looking ahead, XRP has declined as the price drops further toward the $0.53 level. Over the past week alone has been trading on a descending channel, dropping from the $0.58 to $0.52 level. The bears have been persistent recently, with most coins erasing their gains recorded after the Bitcoin spot ETF approval. As of this writing, XRP is exchanging hands at $0.5265, a decrease of 4.79% in today’s session.

Technical indicators on the 4-hour chart show a further decline as the bearish trend continues. Most indicators show a sell signal as the price drops below the Exponential Moving Averages. XRP has dropped below the 50 and 100-day EMAs, suggesting a strong bearish trend. However, XRP could return from the 10-day Simple Moving Average, retracing toward the $0.5500 level.
In conclusion, XRP shows promising signs on the monthly chart, with the Multi-Year Ascending Trend Line as a critical point of interest. Traders should closely monitor the MACD for further confirmation of the bullish momentum. As the crypto market often moves swiftly, stay prepared for both possibilities; a surge toward $2.0 or a pullback toward $0.2 is essential.


