


- Ondo encounters strong resistance at $1.2440, critical for future upward trends.
- Bonk shows promise within an ascending triangle, suggesting an imminent rally.
- Increased trading volume indicates rising investor interest in ONDO and BONK.
Ondo price has seen notable downward trends, as analyzed by the Crypto Busy using a 4-hour Heikin Ashi chart. The technical review revealed Ondo is navigating a descending channel, facing resistance and support crucial for its future trajectory.
As of this writing, Ondo trades at roughly $1.1768. It confronts significant resistance at $1.2440, aligning with the 50% Fibonacci retracement level. This resistance is pivotal, as a breakthrough could signal stronger upward movements.
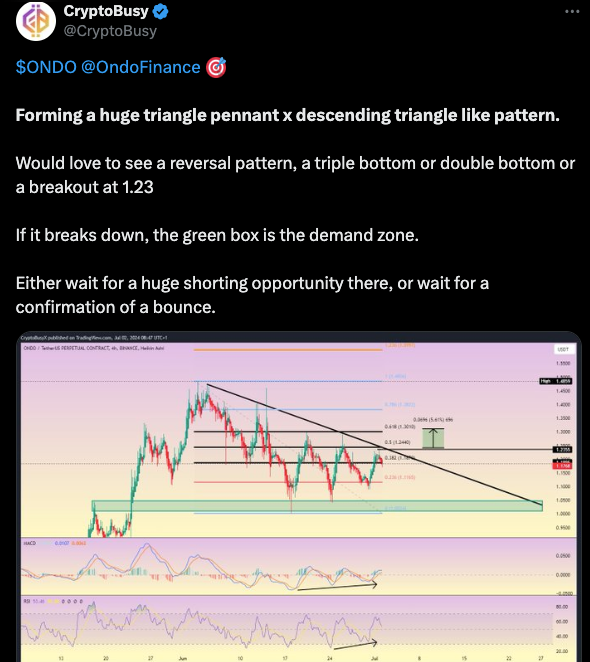
Conversely, support is found at the 0.236 Fibonacci level of $1.1165, suggesting a potential stabilization point.
Regarding technical indicators, the Moving Average Convergence Divergence (MACD) shows an emerging bullish crossover, hinting at a possible positive shift. However, the Relative Strength Index (RSI) at 53.46 indicates a balanced market condition, with neither overbought nor oversold pressures dominating.
Traders should monitor these Fibonacci levels closely, as they offer insights into potential support and resistance zones. A break above $1.2440 could test the 0.786 level at $1.3822, which would present significant resistance in case of a bullish reversal.
Crypto Busy noted the descending pattern’s potential for a bearish continuation but didn’t rule out a reversal, which could occur if market conditions turn favorable. The analyst suggests vigilance for either a robust shorting opportunity or confirmation of an upward bounce, especially around the discussed technical levels.
Over the past 24 hours, the cryptocurrency Ondo (ONDO) has decreased in value by 1.26%, settling at a price of $1.18, according to data from CoinMarketCap.
Despite the decrease, the trading volume for ONDO has surged by 11.63%, indicating a heightened level of investor activity. The market cap of ONDO stands at approximately $1.64 billion, positioning it 56th in the market cap rankings.
Altcoins Poised for Major Rebound: Analysts Signal Bullish TrendsIn a recent post on X, analyst Crypto Jack highlighted a potential bullish breakout for Bonk (BONK), identifying the cryptocurrency as poised for significant upward movement. Jack’s detailed chart illustrates Bonk currently resting at a critical support level within an ascending triangle pattern, a classic bullish indicator in market technicals.
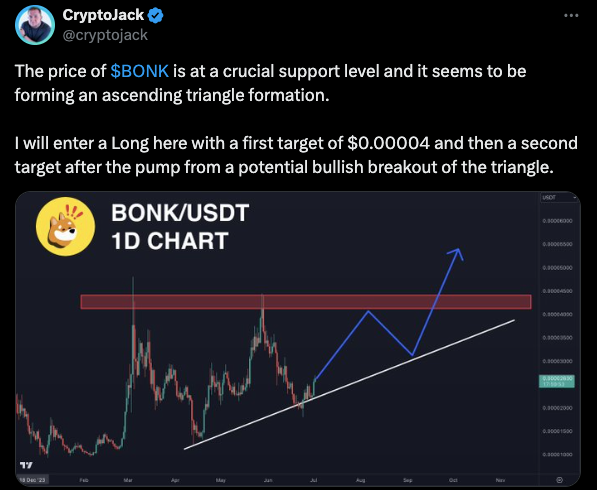
As of the latest update, Bonk’s price is stationed near the triangle’s lower trendline, suggesting a possible surge if it maintains its momentum above this crucial point. Jack proposes a trading strategy to go long on BONK, targeting an initial price of $0.00004.
If Bonk breaches its upper boundary marked in red on the chart, it could validate Jack’s bullish forecast, offering a lucrative window for those positioned to capitalize on the movement.
Bonk has experienced a notable increase, as reflected in the recent trading statistics on CoinMarketCap. Over the past day, Bonk’s price surged by 12.99%, bringing its current value to $0.00002669. This growth coincides with an 87.25% rise in trading volume, amounting to approximately $371.22 million.


