- Accumulation phases in altcoins often precede significant breakouts, indicating potential future surges.
- Key support levels include $50B and the 0.382 Fibonacci retracement, critical during market corrections.
- RSI peaks around 80 suggest overbought conditions, while current RSI at 51.35 indicates a neutral market stance.
Altcoin markets exhibit a dynamic price trend marked by distinct phases which include accumulation, markup, and expansion as highlighlighted by TechDev, an analyst. Analyzing these phases helps investors anticipate future movements and strategize accordingly. The journey of altcoin prices from 2014 to 2024 provides crucial insights into market behavior and potential future trends.
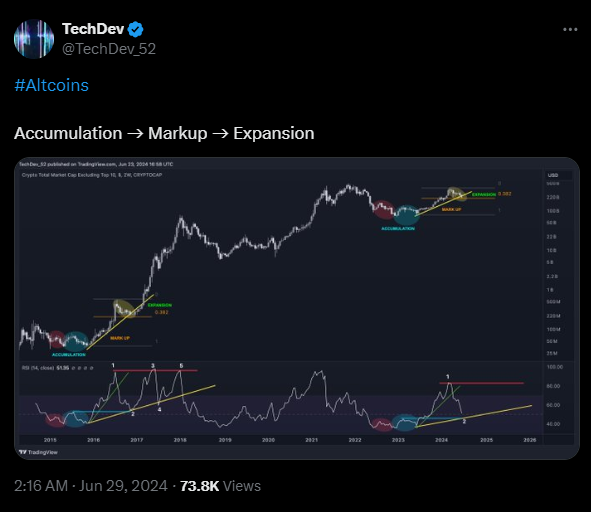
During the Accumulation phase, from late 2014 to early 2016, altcoin prices moved sideways. This period of consolidation indicated a buildup of assets by savvy investors. Such a pattern often precedes significant upward movements, as market participants quietly accumulate positions before a breakout.
The Markup phase, which spanned from 2016 to early 2018, witnessed a dramatic price surge. This rally was driven by strong buying interest and increased market participation. A critical support level during this period was around $50 billion, highlighted by a yellow horizontal line. The sharp price increase indicated heightened investor confidence and a robust market sentiment.
Cryptocurrency Market Analysis: Bullish Trends Amidst Altcoin SurgeThe Expansion phase began in 2019 and extended to the peak in 2021. This period saw altcoin prices soar to unprecedented heights, culminating in a significant peak around $500 billion. The Fibonacci retracement level of 0.382 emerged as a key support during pullbacks, indicating potential bounce-back points during corrections. Additionally, this phase underscored the market’s capacity for dramatic expansion when investor sentiment and market conditions align.
Recent trends post-2021 have shown a decline followed by another accumulation period in 2023. This phase hints at the early stages of a new markup phase, suggested by an upward trend line.
The Relative Strength Index (RSI) further complements this analysis by providing insights into market momentum. Historical RSI trends have shown peaks and troughs aligning with major price movements. Notable RSI peaks occurred during the significant price highs in 2017 and 2021, indicating overbought conditions.
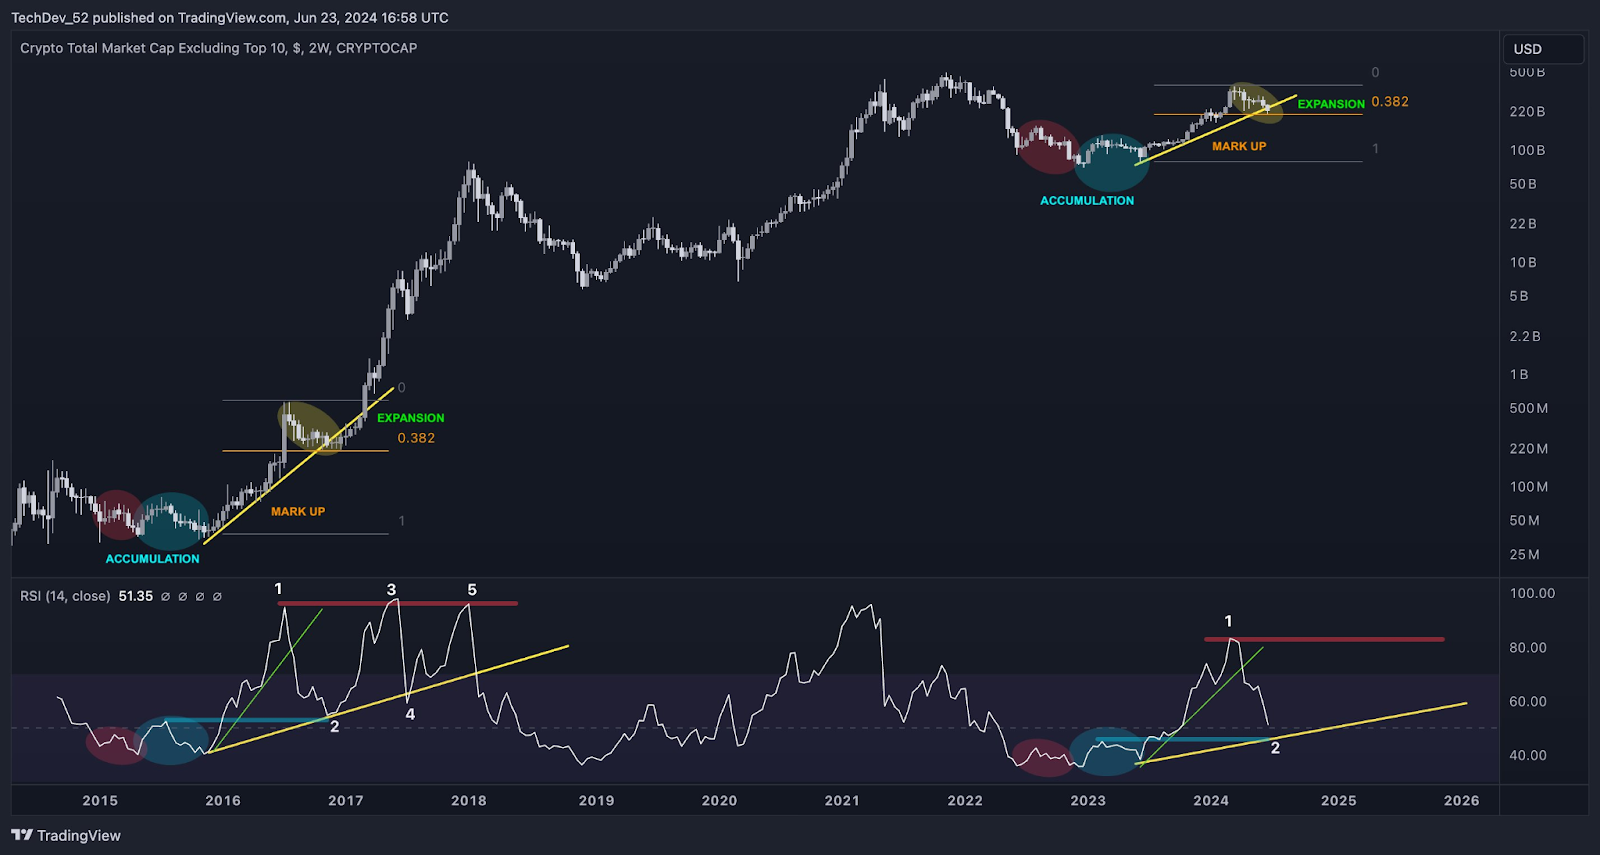
Currently, the RSI has peaked again in 2024, suggesting a possible local top or resistance point. With the RSI pulling back to around 51.35, the market sits in a neutral zone. A crucial support level for the RSI is around 40, where a previous trough was noted in 2023.
Key levels to watch in the altcoin market include historical support around $50 billion and the 0.382 Fibonacci retracement level. These levels often act as strong support during market corrections. Conversely, the significant resistance level at $500 billion, the previous high, remains a critical point. Additionally, RSI peaks around 80 often indicate overbought conditions, suggesting potential reversal points.