


- XRP/BTC shows a bullish trend, echoing 2017’s explosive rise and hinting at a potential high-growth phase.
- Large XRP transfers from Binance hint at major accumulation, possibly fueling anticipation for a price surge.
- Key support at 0.00003000 BTC and resistance at 0.00009995 BTC will be crucial in determining XRP’s future movements.
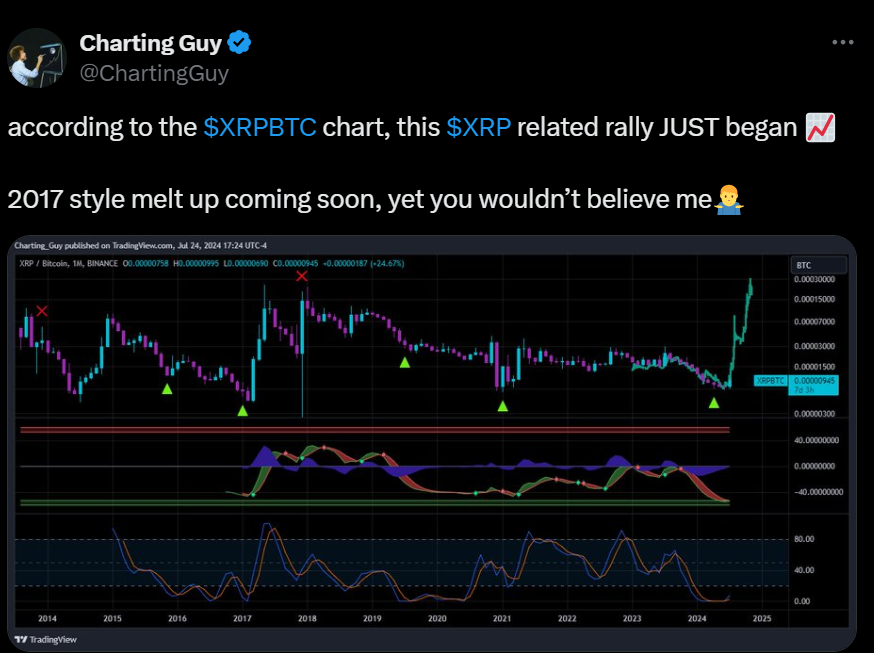
XRP is igniting a new rally that echoes the explosive rise seen in 2017, as highlighted by Charting Guy, an analyst. The recent surge in XRP’s value against Bitcoin (BTC) highlights a potential shift in the market.
The XRP/BTC monthly chart from Binance reveals that the rally has just begun, marked by a bullish trend reminiscent of the dramatic movements of late 2017. This new wave of momentum could signal a return to the high-growth patterns seen in the past.
Whale Alert data shows a notable transfer of XRP from Binance to unknown wallets, indicating possible accumulation by significant players. Recent transfers include 23,831,147 XRP, valued at $14,372,304.
Whale Alert data further showcases other transactions, including 22,574,409 XRP, worth $13,539,429, and 22,579,931 XRP, valued at $13,549,779. This large-scale movement might be fueling anticipation for a substantial price shift.
Examining the XRP/BTC price chart provides insight into the long-term trend. From 2014 to 2024, XRP experienced a downtrend with intermittent periods of consolidation and minor uptrends. However, a notable shift occurred recently. XRP/BTC has broken out from a lengthy consolidation phase, signaling the start of a potential uptrend.
The chart highlights critical support and resistance levels that will likely influence future price movements. Support levels to watch include 0.00003000 BTC and 0.00001500 BTC. These levels have previously provided stability and could act as crucial points of reference if the price pulls back.
On the resistance side, 0.00009995 BTC is currently a significant barrier. This level has seen substantial price action and may present challenges for further gains. If XRP manages to break through this resistance, the next hurdles are at 0.00015000 BTC and 0.00030000 BTC, historical peaks that could serve as formidable resistance.

Momentum indicators are providing bullish signals. The MACD, a key momentum tool, has recently shown a bullish crossover. This pattern has historically led to substantial price increases, similar to movements seen in 2017 and early 2021.
Ripple’s Legal Battle Heats Up: Whales Buy $84M in XRP Amid Settlement SpeculationsAdditionally, the Stochastic RSI, which measures the overbought or oversold conditions, is currently in the overbought zone. This suggests a potential short-term pullback or consolidation before any further upward movement.
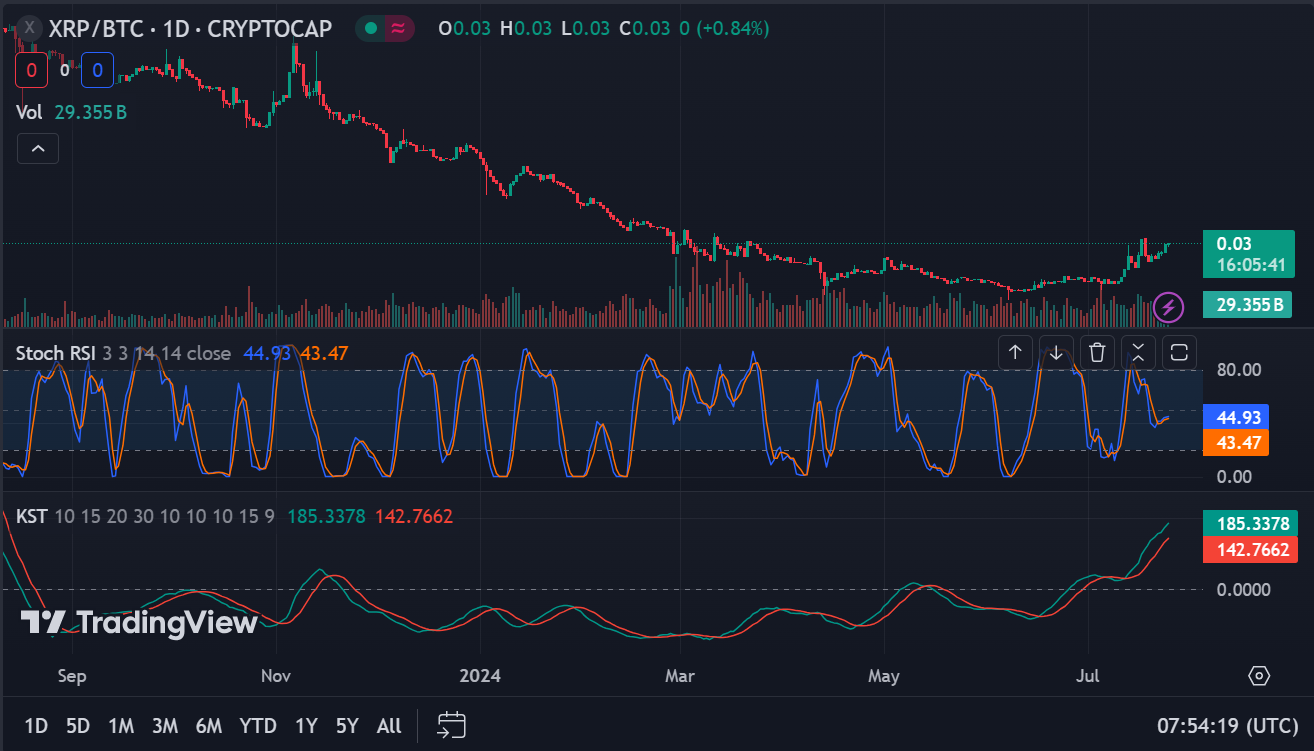
At press time, XRP’s price stands at $0.6086 with a robust 24-hour trading volume of $2,234,961,565, reflecting a 1.11% decline on the last day. The 1-day Stochastic RSI reading above the signal line at 43.78 indicates possible short-term bullish momentum. Moreover, the 1-day KST trading above the zero line suggests that XRP may continue its positive movement against BTC in the near future.


