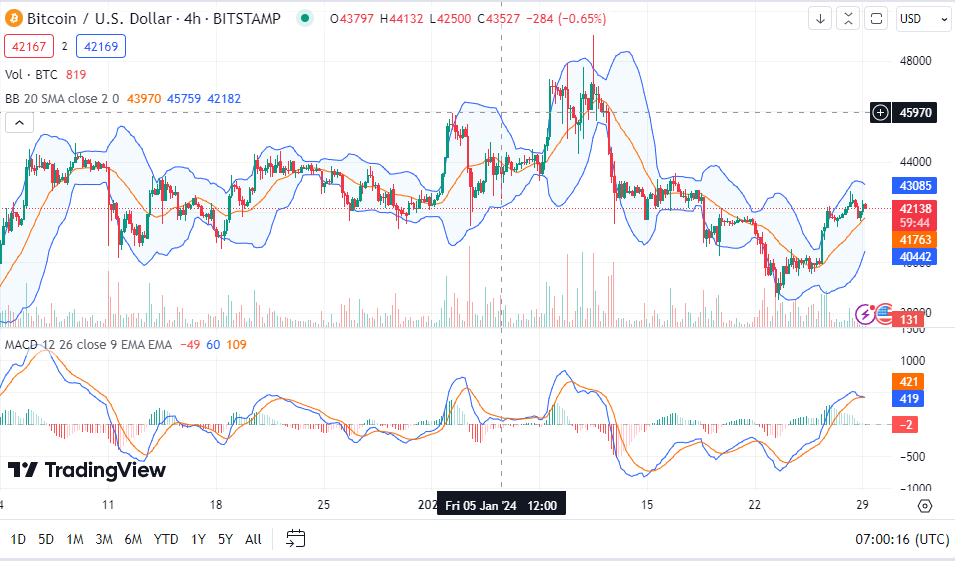
- Analysts spot potential bullish trend for Bitcoin with an inverted HNS pattern forming on the 4-hour chart.
- Bitcoin’s market is balanced with a 4-hour RSI at 60.35, within Bollinger Bands’ support and resistance.
- The 4-hour MACD indicates Bitcoin’s bullish momentum, highlighting key trading levels.
Recently, Bitcoin has been exhibiting noteworthy movements on the 4-hour chart. As per CryptoBusy, an analytic platform, speculation around forming an inverted Head and Shoulders (HNS) pattern signals an upcoming bullish trend. Alternatively, another drop could establish a double bottom, suggesting the potential for a rebound.
The Relative Strength Index (RSI) hints at a descending trend, possibly foreshadowing a Bitcoin value dip. Despite these challenges, the currency’s technical outlook remains modestly optimistic for the medium to long term.
Bitcoin is priced at $42,155.10, with trading volumes reaching $15 billion in the past 24 hours. Despite a slight 0.75% decrease recently, the 4-hour RSI at 60.35 suggests a balanced market without clear signs of overbuying or overselling.
Bollinger Bands further indicate a trading range, with $43,089 and $40,441 acting as the current resistance and support levels, respectively. Moreover, the 4-hour MACD reveals underlying bullish momentum, adding an optimistic tone to Bitcoin’s immediate future.

This analysis offers crucial insights for traders and investors, with the identified support and resistance levels serving as essential markers for strategic decision-making.The RSI and MACD values also offer clues about market sentiment and momentum. However, the potential patterns, such as the inverted HNS or a double bottom, warrant close monitoring. These formations could significantly impact Bitcoin’s trajectory in the near term.
Hence, caution is advised while the market shows signs of bullish momentum. The uncertain nature of cryptocurrencies requires constant vigilance. Investors should keep an eye on these technical indicators and patterns. They play a crucial role in navigating the volatile crypto landscape. Understanding these metrics can help make informed decisions, potentially leading to profitable outcomes in the ever-changing world of Bitcoin trading.


