- Ali’s analysis suggests a bearish turn for Bitcoin due to a drop in IFP below its 90-day average, historically a bearish precursor.
- IFP and Bitcoin prices correlate, with low IFP indicating a bull market and high IFP signaling selling pressure.
- CryptoYoddha’s chart hints at optimism for a bull market post the fourth Bitcoin halving, citing historical halving events as precursors to price surges.
Bitcoin’s latest market trends have sparked considerable attention. Ali, a renowned analyst, recently spotlighted a potential bearish turn for Bitcoin. Notably, the Inter-exchange Flow Pulse (IFP), a crucial indicator tracking Bitcoin flows across exchanges, dipped below its 90-day average. This development, historically a precursor to bearish trends, raises critical questions about Bitcoin’s immediate future.
Ali’s analysis revealed intricate market movements. The Bitcoin Price line, depicted in black, vividly demonstrates the currency’s price volatility. Alongside, the IFP, marked in blue, indicates Bitcoin’s inter-exchange flow. The IFP’s 90-day Simple Moving Average (SMA), shown in purple, offers a broader perspective on market trends. Green and red shaded areas signify bull and bear markets, respectively. A recent uptick in IFP and a Bitcoin price dip suggests a shift toward bearish sentiment.
Moreover, Ali’s chart suggests a correlation between the IFP and Bitcoin price fluctuations. A low IFP indicates holding behavior, hinting at a bull market. Conversely, a high IFP could signal increased selling pressure, aligning with bearish trends.
Additionally, CryptoYoddha, another notable figure in the crypto world, provides insights into Bitcoin’s historical halving events. Their chart encompasses Bitcoin’s journey from 2017, with projections extending beyond 2024. It highlights bear and bull markets in red and blue, respectively. The chart underscores the pivotal role of Bitcoin halvings, which historically precede significant price surges.
Interestingly, the chart features a countdown to the fourth Bitcoin halving, suggesting optimism for an ensuing bull market. It portrays the first three halvings as precursors to market rallies, projecting a similar outcome after the fourth halving.

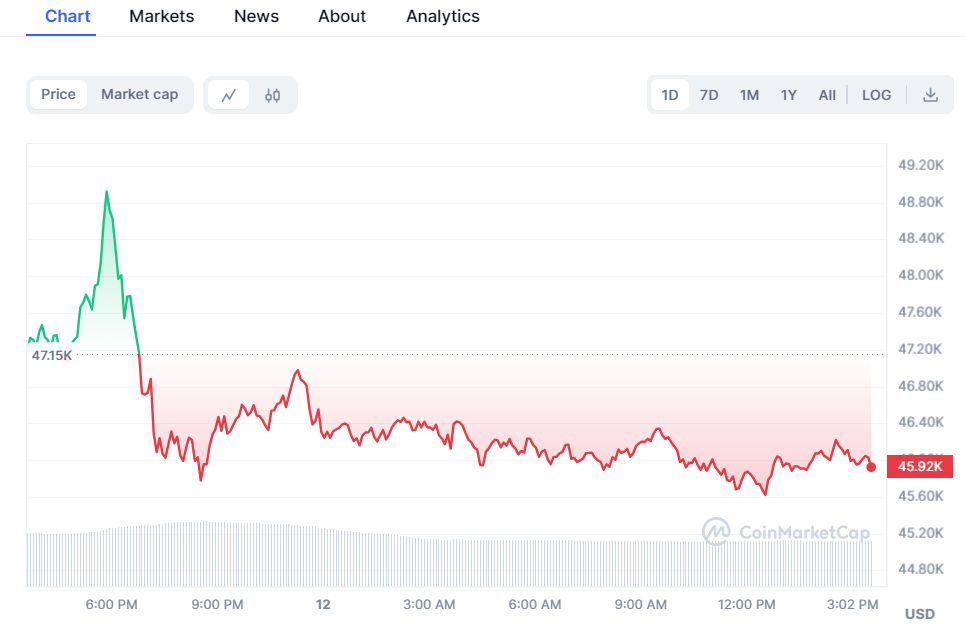
Per recent price data, BTC trades at $45,620.90, down 1.49% in the past day, highlighting the volatile nature of the virtual assets market. Ali and CryptoYoddha’s analyses provide valuable perspectives into Bitcoin’s market dynamics, underscoring the importance of staying informed.


