


- Despite a 50% rally in ARB’s value since mid-October, most token holders are still facing a loss on their investment.
- Current trading patterns predict an imminent correction, as nearly two-thirds of ARB tokens bought at higher prices remain unprofitable.
- Technical analysis indicates Arbitrum may retract to a support level before any further uptick, hinting at the token’s volatile nature.
Arbitrum (ARB) investors have witnessed a remarkable 50% price surge in mid-October 2023, indicating potential market optimism. However, there are signs of exhaustion in the current upswing, with a minor pullback possibly on the horizon. Surprisingly, despite this impressive rally over the last three weeks, the majority of ARB holders find themselves in a challenging position.
Data from IntoTheBlock revealed that nearly 60% of all ARB investors are currently underwater, meaning their ARB holdings are worth less than their initial investment. To put this into perspective, approximately 2.5 billion ARB tokens held across nearly 170,000 addresses were purchased at an average price of $1.400, a significant 27% higher than the current trading price of ARB.
$ARB / $USD – Update
— Crypto Tony (@CryptoTony__) November 7, 2023
Reclaimed $1.05 resistance zone and so the bulls are now in control. Hold the level and pump today please pic.twitter.com/z9WXk9rllp
In a recent Twitter update from Crypto Tony, a recognized authority on cryptocurrency trading, the breach past the $1.05 resistance mark was announced, indicating a bullish takeover. The stance implies that if this threshold is consistently held, there could be an uptick in trading fervor, potentially triggering a rally in today’s market.
This perplexing situation can be attributed to the technical analysis of ARB’s price chart, which indicates the presence of a W-pattern or double-bottom setup. This pattern, resembling the letter W, typically forms after a downtrend and serves as a foundation for a potential trend reversal. It is characterized by a neckline created by connecting the peak of the swing high between the two swing lows. For ARB, this neckline is situated at $0.967.
The bullish target associated with the double bottom pattern is calculated by doubling the distance from the base to the neckline. In the case of ARB, this sets a target price of $1.187, representing a 22% increase from the current trading price. While ARB’s price has already rallied 20% to reach $1.098, caution is advised due to the recent appearance of a red “two” sell signal on the Momentum Reversal Indicator (MRI) in the daily chart. This MRI signal forecasts the possibility of four down candlesticks, indicating a potential short-term correction.
Today’s Arbitrum price analysis indicates a bearish outlook that sets the stage for a minor pullback. At the time of writing, the ARB token is trading at $1.08, with a 24-hour decrease of 4.17%, indicating that a potential correction may be on the horizon. However, despite the potential for a pullback, ARB’s overall market sentiment remains positive as the cryptocurrency continues to gain traction and attract new investors.
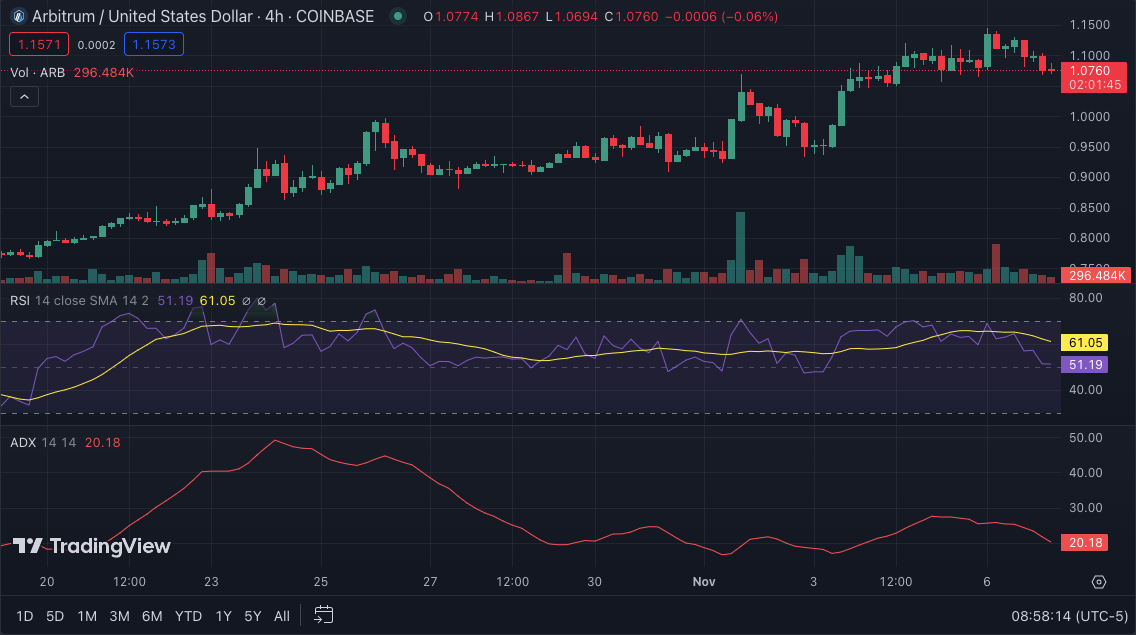
The hourly technical indicators also suggest a potential correction, with 20-EMA and 50-EMA crossing below the price candles, indicating a bearish sentiment. The relative strength index (RSI) indicates a neutral sentiment, with a value of 51. Any decrease in the RSI might confirm a near-term correction. The average directional index (ADX) also indicates a bearish sentiment, with a value of 20. The DI- (red line) has crossed over the DI+ (green line), indicating a potential downtrend.


