


- BNB’s bullish pennant pattern could trigger a significant rally towards $1000 if successfully broken.
- Social volume and sentiment play pivotal roles in influencing BNB’s price movements.
- BNB’s technical indicators hint at a neutral to bearish short-term outlook, with consolidation likely.
The recent downturn in the market has left investors on edge, with Binance Coin (BNB) among those witnessing a notable drop in value. Over the last 24 hours, BNB saw a decline of over 1.09%, trading at $589.35 according to CoinMarketCap. Despite this setback, the coin’s market capitalization remains substantial, standing at over $87 billion.
BNB’s Bullish Pennant Pattern Signals $1000 Surge
What’s catching the attention of many crypto enthusiasts is the bullish pennant pattern forming within BNB‘s price chart. Renowned crypto analyst, World Of Charts, highlighted this pattern in a recent post, suggesting that if BNB successfully breaks out of this consolidation phase, it could spark a significant bull rally. It could potentially propel BNB’s value towards the $1000 mark in the near future.
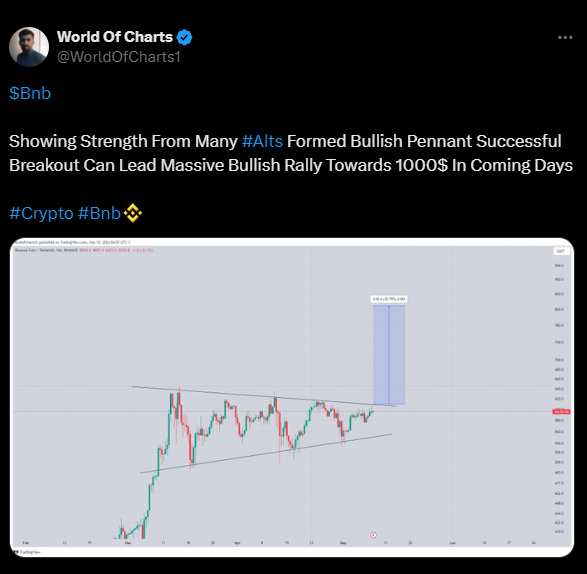
Taking a closer look at BNB’s recent price trends, there’s been notable fluctuation, particularly marked by a sharp increase in late March, leading to a peak around $637 in early April. However, following this peak, the price experienced a decline before stabilizing, maintaining levels above $500.
BNB Price Fluctuates
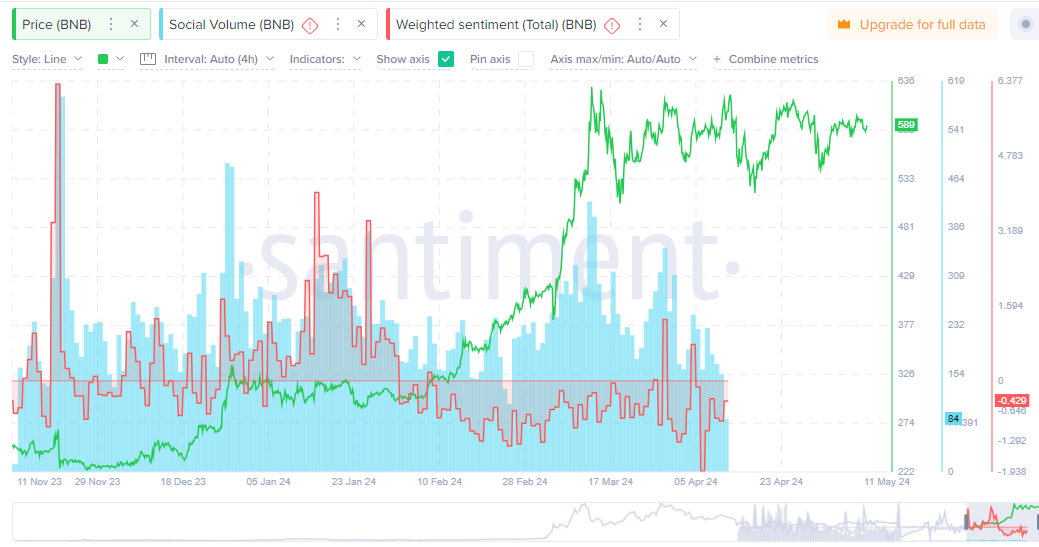
Social volume, as indicated by the light blue bars, has played a crucial role in influencing BNB’s price movements. Notable spikes in social volume often precede or coincide with significant price fluctuations, indicating increased public interest and discussion impacting market sentiment.
The weighted sentiment, represented by darker blue shading, has generally remained neutral or slightly positive, with fluctuations correlating with changes in price and social volume. However, there have been instances of negative sentiment, particularly following the price peak in April.
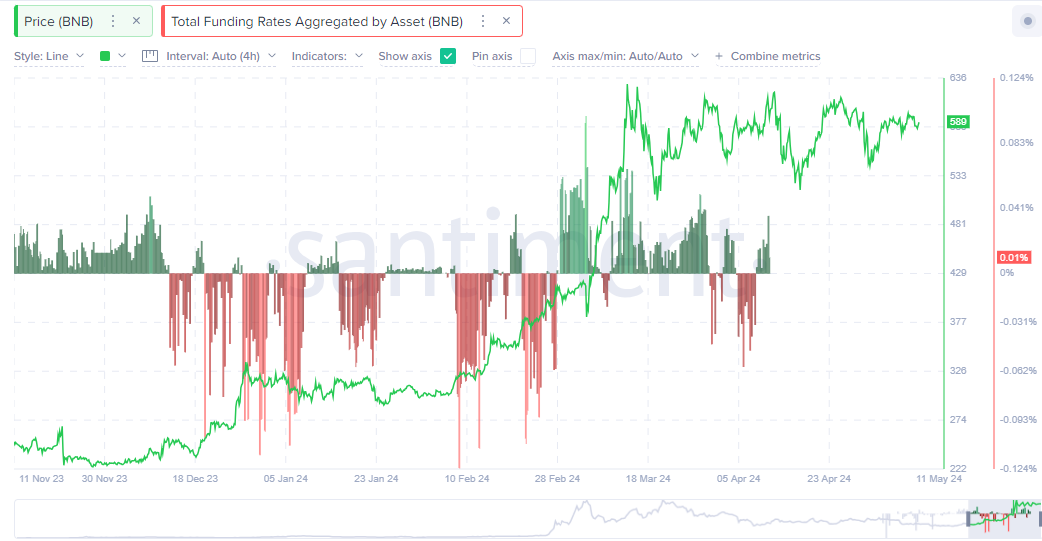
Total funding rates, displayed in red, provide insight into the derivatives market sentiment. These rates, whether positive or negative, reflect market sentiment and the balance between long and short positions. The correlation between funding rates and BNB’s price suggests a complex relationship, with fluctuations influencing price movements.
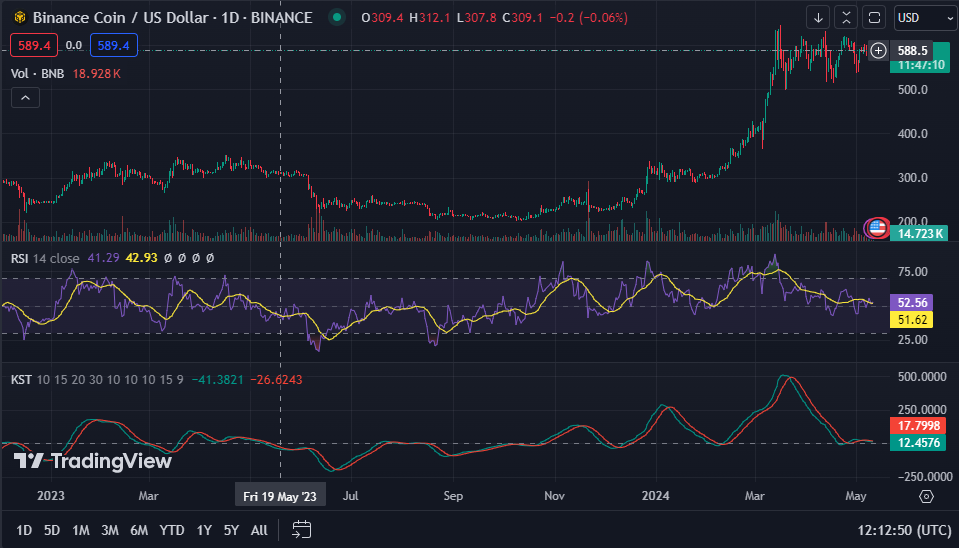
Analyzing technical indicators, BNB’s 1-Day RSI reads 52.43, indicating a neutral market sentiment. However, the 1-Day MACD trading below the signal line at 3.6 suggests a potential bearish trend in the short term. Meanwhile, the 1-Day KST hovering around the zero line at 12.3987 suggests possible consolidation in the near future.


