- BNB faces a potential downturn amid concerns of market manipulation and parallels to FTT and LUNA crashes.
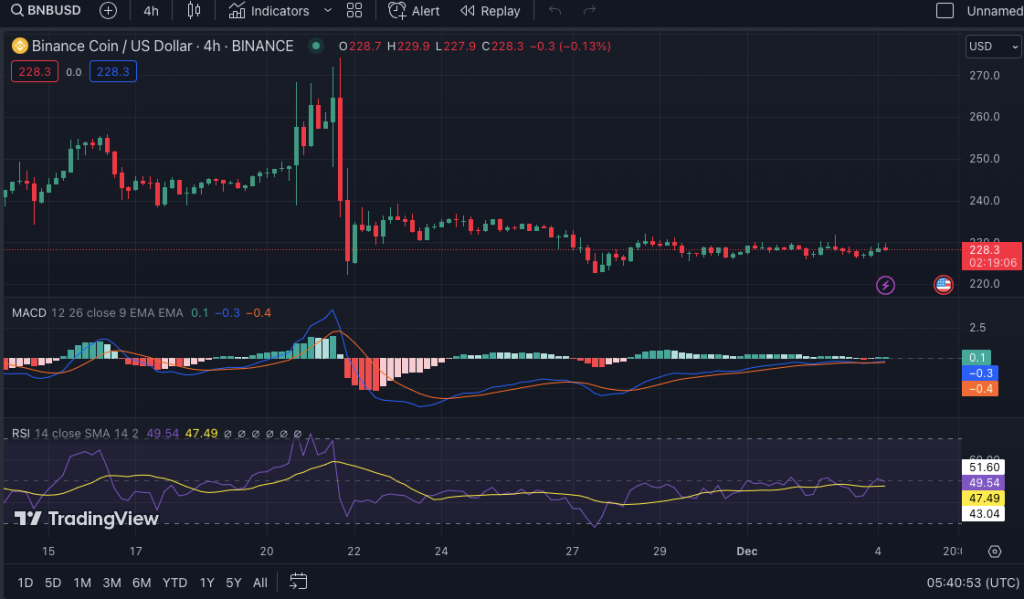
- Traders eye BNB’s price pattern and MACD, and RSI indicators for signs of a major sell-off, mirroring past crypto collapses.
- Binance’s significant BNB holdings and recent BUSD restrictions may contribute to heightened market volatility and risk.
In the world of cryptocurrency trading, the focus now shifts to Binance Coin (BNB) as indicators point to a potential downturn. With Binance, the world’s largest cryptocurrency exchange, holding a significant portion of BNB, concerns arise about potential selling pressure akin to the FTX Token (FTT) scenario. As highlighted by il Capo of crypto, an analyst, historical parallels with FTT and LUNA, which experienced dramatic crashes, influence traders’ sentiment.
The average entry point for short positions on BNB is currently at $280, with a target dip of $40-45. This strategy is a calculated swing trade, implemented with minimal leverage and not intended as financial advice.
Fundamentally, BNB’s market behavior raises red flags. The notable rally in early 2021, primarily driven by Binance USD (BUSD) swap transactions, hints at artificial price manipulation as noted by CryptoCapo. Changpeng Zhao, former CEO of Binance, conducted these transactions publicly, mirroring Sam Bankman-Fried’s tactics with FTT. The recent restriction on creating new BUSD by Paxos has cut off a potential avenue for market manipulation, potentially impacting BNB’s price.
Technical indicators further support this bearish outlook. A visible distribution pattern above the ‘dark zone’ on BNB’s chart suggests that major holders, possibly including Binance, are unloading their holdings. This is confirmed by the market’s decisive move below a key support level, tested multiple times. Such patterns bear a striking resemblance to those observed in FTT before its crash.
The MACD and RSI indicators provide additional insight. The MACD, shown below the main chart, features a blue and an orange line crossing over, with a histogram depicting the difference between the two moving averages. This setup helps identify shifts in market momentum. The RSI, oscillating between 0 and 100, currently stands at 49.55, indicating a neutral market.

Currently, BNB’s price is $229.42, reflecting a slight increase over the past week. With a circulating supply of 150 million BNB, its market cap stands at approximately $35.37 billion. These figures, combined with the discussed fundamental and technical factors, suggest a cautious approach for traders and investors in BNB.


