


- Bitcoin’s descending channel suggests a prevailing downtrend.
- RSI bullish divergence indicates weakening downward momentum.
- Potential breakout from the descending channel could lead to a price increase.
Bitcoin’s price action reveals a potential bullish reversal, according to an analysis shared on X by analyst Charting Guy. Bitcoin has formed a descending channel, characterized by progressively lower highs and lows evident in his chart. Despite this downtrend, the RSI shows signs of bullish divergence, suggesting weakening downward momentum.
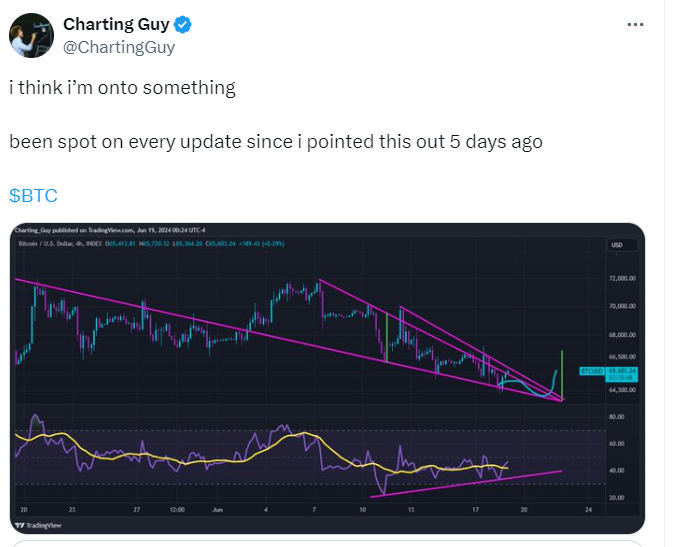
Charting Guy’s chart highlights the presence of a descending channel on Bitcoin’s chart, marked by two parallel pink lines. This pattern outlines the current downtrend. The RSI trends below the 60 mark, which envisions a bearish scenario. However, a bullish deviation is evident as the RSI forms higher lows while Bitcoin’s price makes lower lows.
The bullish divergence is underscored by a purple trend line on the RSI chart. This indicates that the downward momentum might be losing strength. Consequently, a potential price reversal could be on the horizon. The chart also projects a possible sharp upward movement, represented by a green arrow. This projection suggests an anticipated breakout from the descending channel, potentially leading to a significant price increase.
Charting Guy’s analysis aligns with his recent posts, where he pointed out the bullish divergence on the 4-hour chart. He emphasized the need to wait for the 4-hour close to confirm or invalidate this signal. His latest update notes that the bullish divergence observed in the RSI could lead to a breakout from the current downtrend.
Analyst Predicts Major Bitcoin Buy Signal as Hash Ribbons Near Critical PointMoreover, Charting Guy’s analysis has been spot-on since his initial observations five days ago. His analyses indicate a cautious but optimistic outlook for Bitcoin. He advised to monitor the 4-hour closes closely for confirmation of the bullish divergence which he confirmed.
Pricing information from CoinGecko shows that BTC trades at $65,511.19 at press time. This portrays a dip by 0.11% and 2.77% in the last day and week respectively. If the bullish divergence plays out, traders could see a breakout from the downtrend. This scenario presents a potential buying opportunity for those closely following technical signals.


