- Bitcoin’s price near $52,600 faces a pivotal moment, with a break signaling bullish momentum or rejection leading to potential downside correction.
- Technical indicators like RSI and Bollinger Bands suggest Bitcoin’s market is slightly overbought, indicating a possible correction or consolidation.
- Additional catalysts beyond market dynamics, such as positive news or developments, may be needed for Bitcoin to sustain its upward momentum.
Bitcoin’s price movements are a focal point for investors and enthusiasts alike, as its recent flirtation with significant resistance and support levels has sparked intense speculation about its next move. With the cryptocurrency currently priced at $51,939.73 and experiencing a slight decline of 0.27% in the last 24 hours, market watchers are on the edge. Over the past day, the trading volume has reached a staggering $35.2 billion, highlighting the intense activity surrounding Bitcoin.
As per CryptoBusy, an analytic platform, one critical level that investors are eyeing is the $52,600 mark, representing a formidable resistance level for Bitcoin. A break above this threshold, particularly with a confirmation candle on the 1-hour time frame, could signal the start of a bullish phase.
Historical patterns have shown that surpassing key Fibonacci levels, such as the 382, 0.5, and 0.618 ratios, often precede significant price rallies. According to Fibonacci retracement analysis, the next major resistance level lies at $57,400.
As further highlighted by CryptoBusy, the journey to these heights is fraught with potential pitfalls, as a rejection at $52,600 could see Bitcoin correct down to $51,400.This movement might form a head and shoulders pattern, with the neckline potentially leading to a retest of the $50,000 level. Such technical formations are watched closely by traders to indicate future price directions.
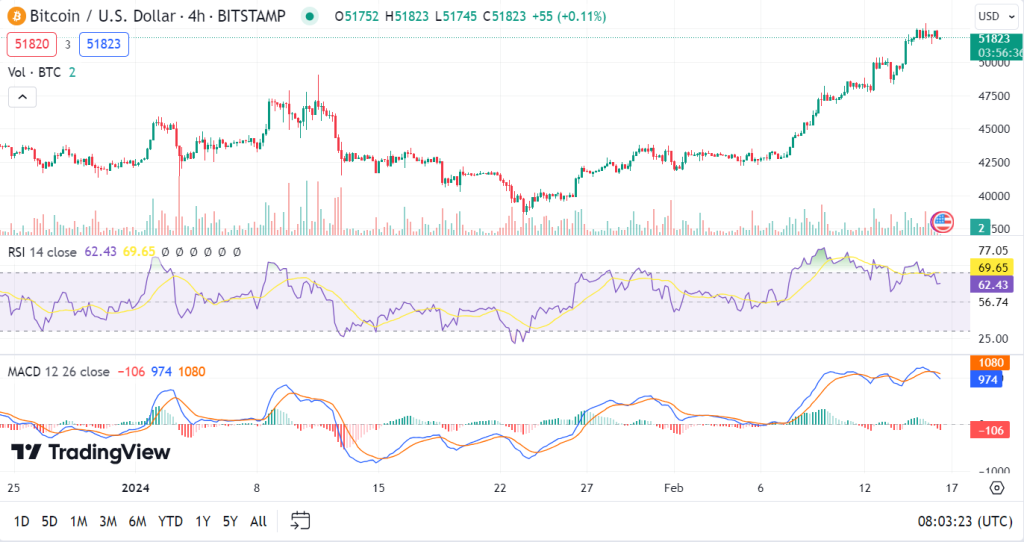
Additionally, the current market conditions, as indicated by various technical indicators, provide a mixed outlook. The 4-hour Relative Strength Index (RSI) reading of 62.43 suggests that Bitcoin is slightly overbought. This situation could imply an impending correction or consolidation.
The Bollinger Bands further support this view, with the upper band at $53,435 hinting at nearing resistance and the lower band at $48,595 indicating possible support levels. Moreover, the bullish trend is underscored by the Moving Average Convergence Divergence (MACD), where the MACD line surpasses the signal line.

For Bitcoin to sustain its upward momentum, it may require more than just market dynamics. The weakening buying volume and a divergence from the price indicate that additional catalysts might be necessary. Positive news or developments in the cryptocurrency space could serve as the much-needed driver to push prices higher.
Bitcoin stands at a critical juncture, with its next move heavily influenced by technical resistance levels, market sentiment, and potential external catalysts. Investors and traders must remain vigilant, analyzing the interplay of various indicators and market dynamics to navigate the volatile waters of cryptocurrency trading.


