


- TD Sequential shows a Bitcoin sell signal, suggesting a potential reversal below $67,500.
- Closing above $67,500 invalidates the Bitcoin sell signal, says analyst Ali Martinez.
- Key resistance at $67,000-$68,000 crucial for Bitcoin’s price action, analysts report.
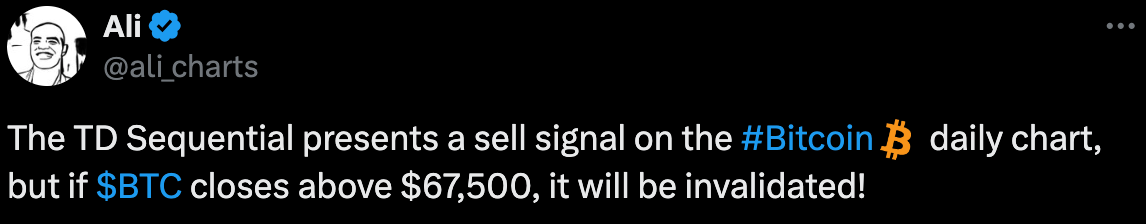
Ali Martinez, an analyst on X, has provided insights into Bitcoin’s current market movements. According to Ali, the TD Sequential indicator on the Bitcoin (BTC) daily chart is signaling a potential sell. However, this bearish indication could be invalidated if BTC closes above $67,500.
Ali’s chart shows Bitcoin trading on Kraken’s exchange. The recent daily candle is green, closing at $67,030.1, after opening at $63,960.7. This represents a significant price increase within the day. The TD Sequential, a popular indicator among traders, has flashed a sell signal, marked by a red arrow above the current candle. This signal typically suggests a potential reversal or a slowdown in the ongoing uptrend.
Crucially, the resistance level of $67,500 is pivotal. If Bitcoin manages to close above this threshold, the TD Sequential’s sell signal will be nullified. This could imply that the uptrend might continue unabated.
Bitcoin, XRP, and Dogecoin Struggle Amidst Market Decline: What’s Next?Ali’s analysis also points to recent price movements showing a mix of green and red candles, indicating a consolidation phase before the current bullish breakout. This surge suggests renewed buying interest and momentum in the market.
Another analyst on X, Jelle, provides a broader perspective on Bitcoin’s price action. Jelle notes that Bitcoin’s monthly chart appears ready for a significant upward move, likening it to an “Apollo mission.” This analogy implies that Bitcoin is poised for a substantial bullish breakout.

Jelle’s monthly chart displays Bitcoin’s price action from 2016 to the present, showing a clear long-term uptrend. Multiple peaks and troughs indicate cyclical behavior but an overall upward trajectory. The current monthly candle is positioned at $67,026.16, suggesting a consolidation phase near this level, which represents previous resistance and potential support.
Jelle emphasizes that the consistent pattern of higher highs and higher lows reinforces the bullish sentiment. This pattern is a classic sign of a strong uptrend. However, in case of a pullback, key support levels to watch include the previous significant peaks around $45,000 and $30,000. These levels have historically acted as strong support during corrections.


