- Bitcoin nears oversold territory with RSI at 40.98, signaling a potential relief rally.
- Key Fibonacci support for Bitcoin lies at $51,412, with further downside to $44,552.
- Bitcoin faces immediate resistance at $59,899 amid bearish sentiment and volatile moves.
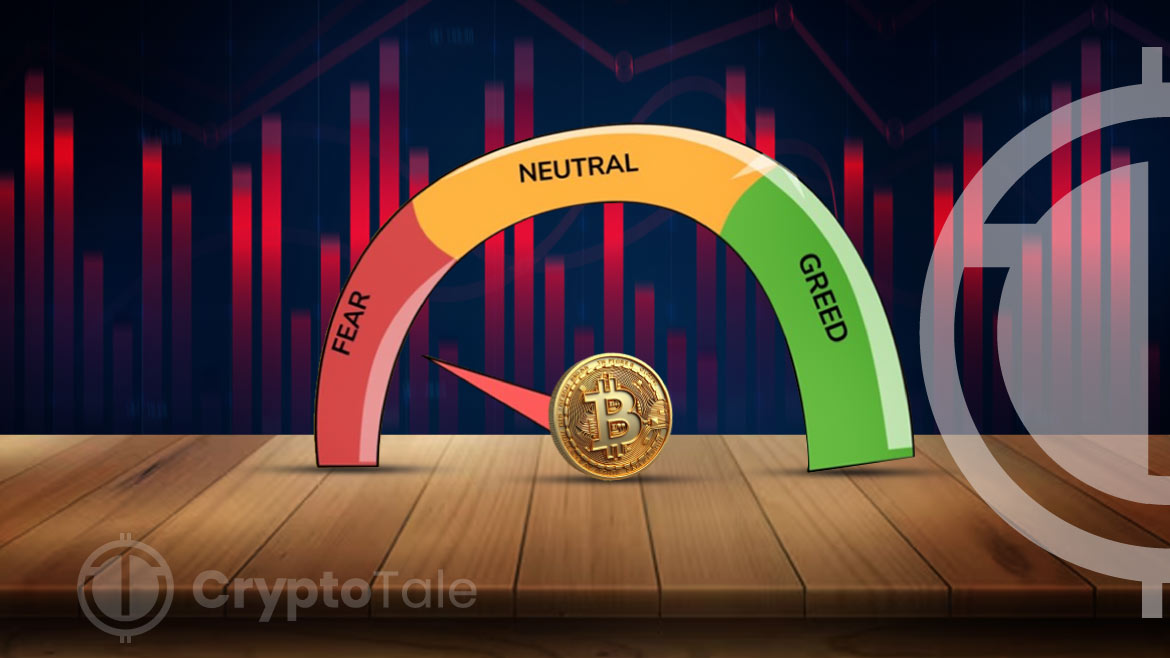
Bitcoin continues to exhibit volatile price movements, with market sentiment reflecting extreme fear. The Crypto Fear and Greed Index currently sits at 22, signaling that traders are deeply concerned about further declines in Bitcoin’s value.

Traders and analysts are expressing cautious sentiments, with prominent figures like Arthur Hayes, Co-Founder of BitMEX, predicting further downward pressure on Bitcoin. He recently revealed his expectation for Bitcoin to dip below $50,000 this weekend, highlighting his bearish stance with a short position.
Similarly, an analyst, Altcoin Sherpa, suggested that Bitcoin may fall to $45,000. At press time, Bitcoin’s price hovered around $56,659.57, down 0.87% in the last 24 hours, with significant trading volume reaching $30.33 billion. This price movement comes as Bitcoin struggles to break through key resistance levels, and technical indicators hint at potential further downside.
Altcoin Sherpa’s weekly chart analysis reveals that Bitcoin’s price is just below the 0.236 Fibonacci retracement level at $59,899, suggesting a bearish trend is forming. Moreover, technical analysis points to critical support and resistance levels. The first significant support level lies at the 0.382 Fibonacci retracement level, around $51,412. This zone may be a crucial area where Bitcoin could stabilize or bounce quickly.
Bitcoin Steady Amid Mixed Crypto Market and Fear Index at 29If selling pressure continues, the next significant support level is at the 0.5 Fibonacci retracement mark, approximately $44,552, a key target area for many traders. Should Bitcoin breach this, deeper corrections could push the price toward the 0.618 Fibonacci retracement level, which is $37,693.
On the resistance side, Bitcoin faces immediate pressure at $59,899, where the 0.236 Fibonacci retracement level is a critical barrier. If Bitcoin recovers this level, it could signal a potential reversal, with the next upward resistance at $73,618.
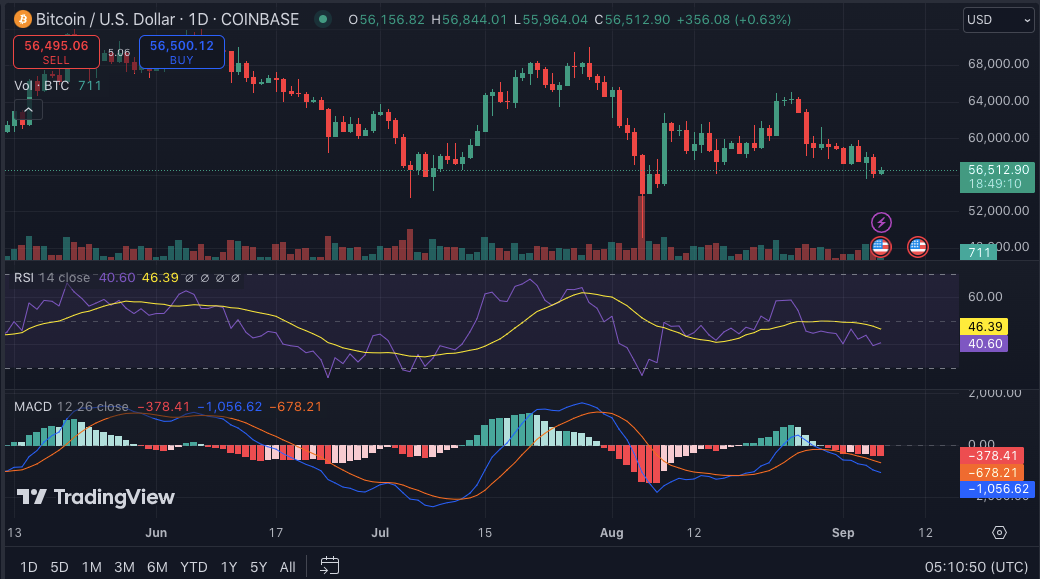
Additionally, technical indicators are pointing to potential oversold conditions. The daily Relative Strength Index (RSI) for Bitcoin reads 40.98, indicating that the cryptocurrency is nearing oversold territory. This could suggest a possible relief rally or reversal in the future.
Furthermore, the Moving Average Convergence Divergence (MACD) is below the signal line, reinforcing the likelihood of continued bearish momentum and hinting at a possible recovery as negative momentum weakens.