


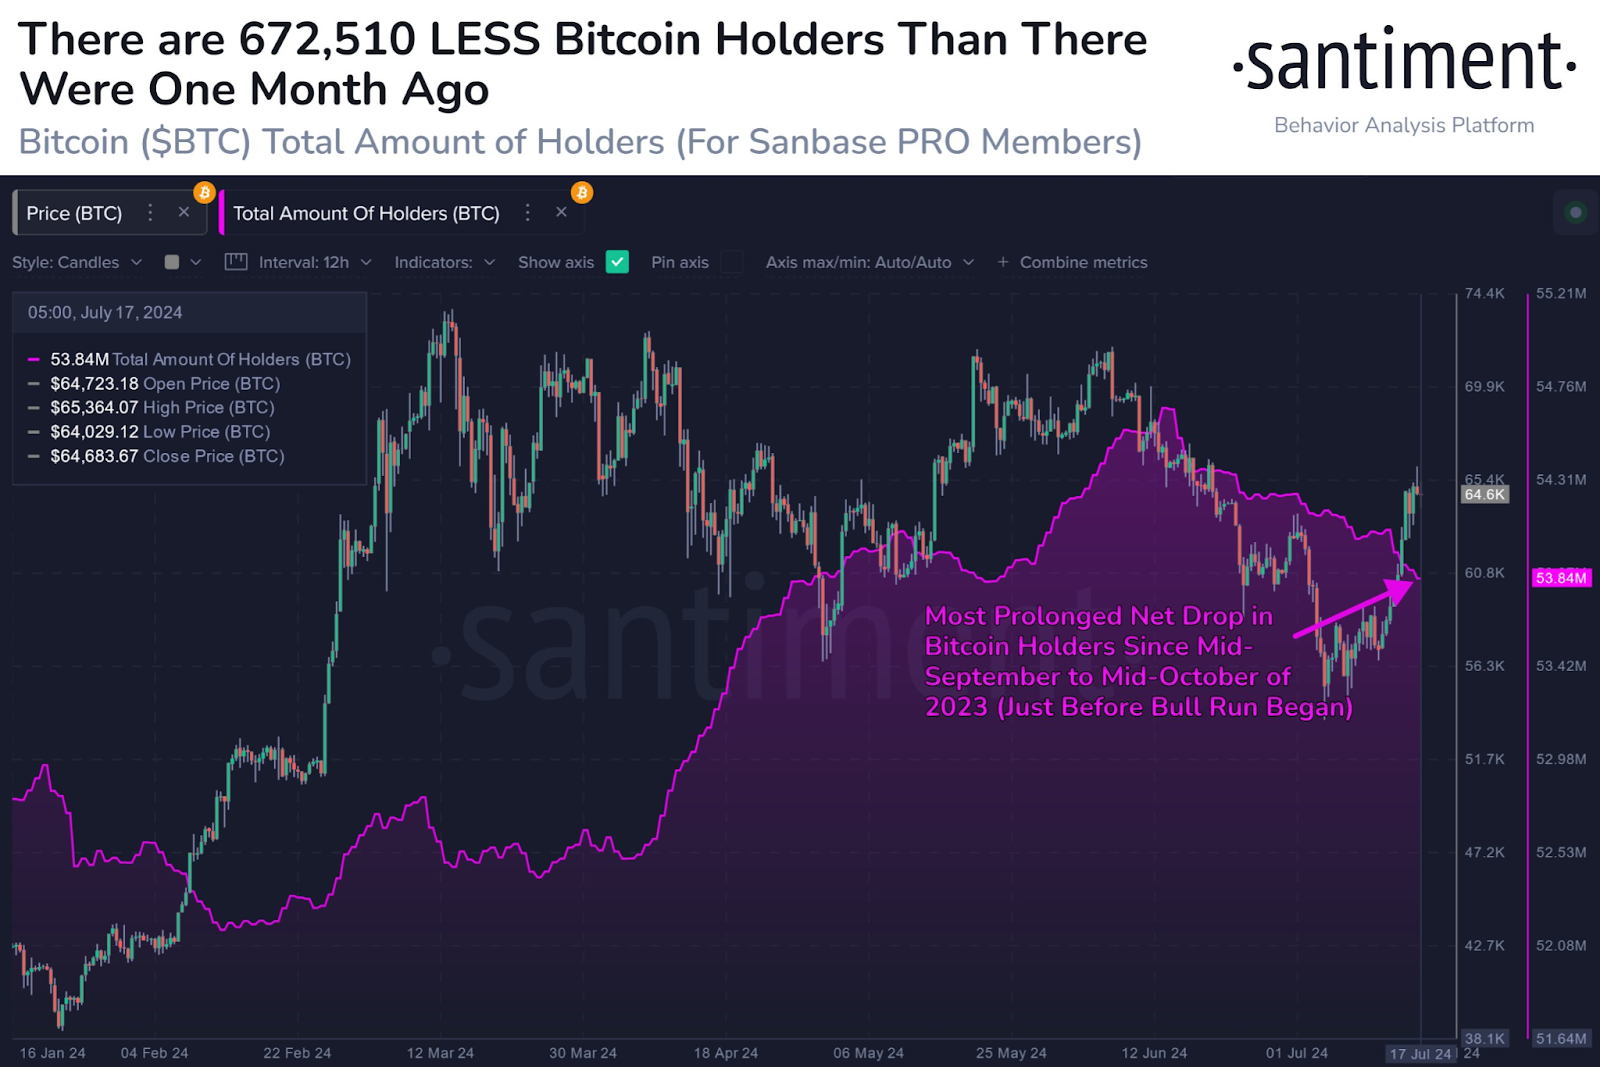
- Bitcoin holders drop of 672,510 in a month signals potential market shifts despite stable prices.
- Strong support near $63,000 and $64,000 indicates robust buying interest amid recent liquidation pressures.
- Watch for a potential break out above $65,000 or breakdown below $63,000 for significant market movements.
Bitcoin’s number of holders has significantly decreased, signaling potential market shifts and changing investor sentiment. Recent data from Santiment reveals a drop of 672,510 Bitcoin holders in the past month. This reduction marks the most prolonged net decline since mid-September to mid-October 2023.
Despite this, Bitcoin’s price has remained relatively stable. As of July 17, 2024, Bitcoin opened at $64,723.18. Then it has hit a high of $65,364.07 and a low of $64,029.12 to close at $64,683.67. The stability in price amidst a significant reduction in holders suggests critical market dynamics worth monitoring.
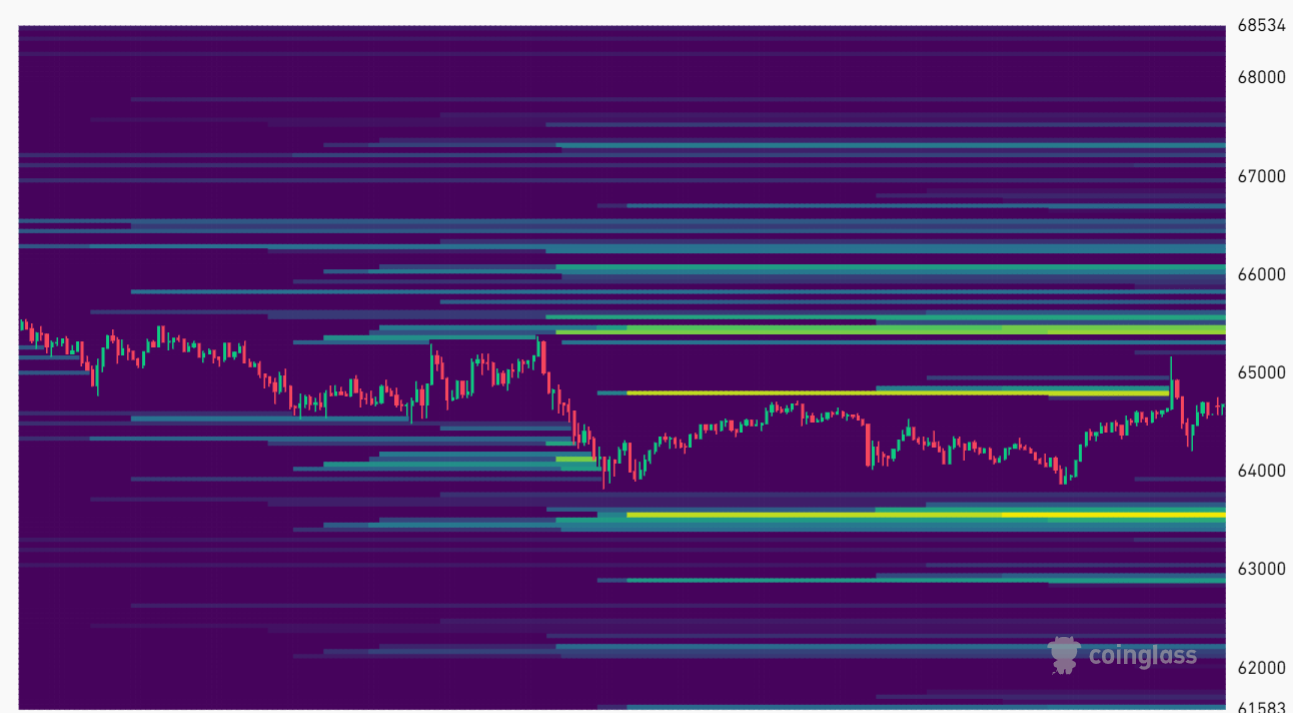
The aggressive decline in Bitcoin holders can be attributed to traders’ belief that the March all-time high (ATH) was the peak for 2024. This sentiment is driving liquidations, increasing the probability of a market rebound. Key observations from recent market activity show a substantial liquidation at specific support and resistance levels.
Support levels are notable around $63,000 and $64,000. The prominent yellow and green map on the liquidation heatmap indicates strong support at these levels.
Bitcoin Surges Above $65K: XRP, Solana, and Dogecoin Lead Crypto GainsThese support levels suggest a strong buying interest. Conversely, resistance levels are observed around $65,000 and $66,000. Multiple liquidation bands at these levels indicate zones of increased selling pressure.
The price movement of Bitcoin initially showed a downtrend over the past 24 hours with significant liquidation activity. This is followed by a consolidation phase between the $63,000 to $65,000 range. Occasional price spikes indicate attempts to break through resistance levels, followed by retracements.
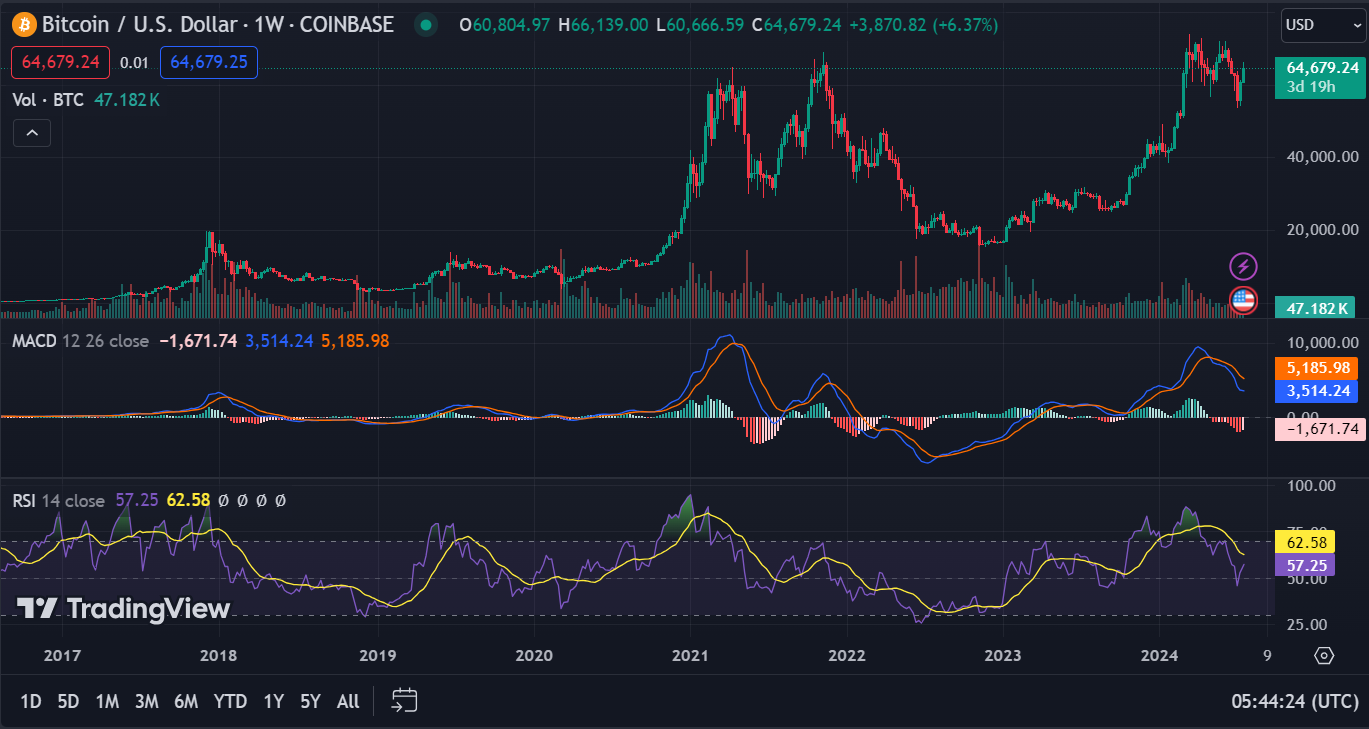
At pres time Bitcoin was trading at $64,490.50, with a 24-hour trading volume of $30,781,197,478. Bitcoin has decreased by 2.15% in the last 24 hours. The 1-week Relative Strength Index (RSI) reads 57.06, indicating the market is neither overbought nor oversold. The 1-week Moving Average Convergence Divergence (MACD) trading below the signal line suggests a potential bearish trend.


