- Bitcoin’s MPI surged to 9.43, signaling increased movement of BTC to exchanges, potentially indicating upcoming sales by miners.
- Miner selling activity, as indicated by a high MPI, can increase Bitcoin supply, possibly affecting market prices.
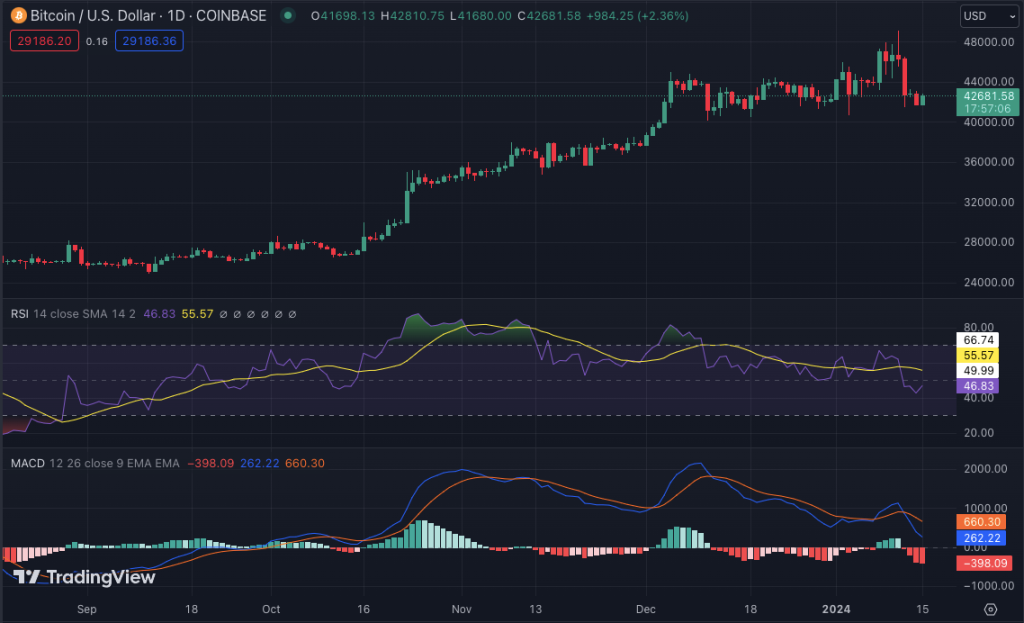
- The BTC/USD pair has been under the crucial $45,000 mark, with a current valuation of around $42,700, suggesting hesitant market momentum.
Bitcoin has recently witnessed a significant development in its market dynamics. On January 12, an important indicator known as the Bitcoin Miners’ Position Index (MPI) reached a notable peak of 9.43. This metric is crucial as it sheds light on the behavior of Bitcoin miners, a key group in the cryptocurrency ecosystem.
The MPI measures the amount of Bitcoin being transferred by miners to exchanges. Typically, a high MPI value suggests that miners are moving larger quantities of Bitcoin to exchanges than usual, often interpreted as an indicator of potential sales.
A cryptocurrency analyst, Ali, shared an insightful post highlighting this recent spike in the Bitcoin Miners’ Position Index (MPI) and its implications for the market.
This trend is particularly noteworthy after a recent correction in Bitcoin’s price. The increase in the MPI suggests that miners are looking to sell their Bitcoin holdings to capitalize on current market prices or cover operational costs. It’s important to note that miners’ actions can significantly impact the Bitcoin market. As miners control a substantial portion of the total Bitcoin in circulation, their decision to sell can increase the supply of Bitcoin in the market, potentially leading to downward pressure on prices.
Bitcoin, the trailblazing digital currency, has been experiencing significant market movements recently. A close analysis of the BTC/USD pair reveals a persistent struggle to maintain a level above the crucial $45,000 mark. This trend follows a downturn where the cryptocurrency market saw a notable decline. Presently, Bitcoin’s value hovers around an impressive $42,700. This represents a modest decrease of approximately 0.7% in the past day, hinting at a lukewarm buying interest in the market.
In the last 24 hours, Bitcoin has witnessed a remarkable surge in trading volume, soaring by 128% to reach $19.67 billion. This activity has positioned Bitcoin prominently in the CoinMarketCap rankings, with a market capitalization of $840.759 billion. Bitcoin’s market dominance stands at 49.8%, a significant indicator of its influence in cryptocurrency.
Previously, Bitcoin’s price fluctuated within a tight range between $42k and $45k. However, the digital currency soon encountered a dip, shedding around 2% of its value within a week. During this phase, the price movement appeared stagnant, reflecting a standoff between buyers and sellers, indicating market indecision. Following this period of uncertainty, Bitcoin exhibited notable price volatility, underscoring the unpredictable nature of the market.
The potential for a bullish trend seems plausible, especially if Bitcoin’s price stabilizes above the $42k threshold. Should this trend persist, Bitcoin might gain enough momentum to challenge its next resistance level at $45k in the near future. Conversely, Bitcoin’s price could decrease if the bullish grip loosens and momentum decreases, potentially retesting the support level around $41k. Moreover, a stronger bearish influence could push the price even lower, possibly towards a support level near $ 40k in the short term.

The market’s technical indicators currently lean towards a bullish sentiment. The Relative Strength Index (RSI), with readings at the 48 level, indicates a neutral market. The 20-day Exponential Moving Average (EMA) above the 50-day EMA reinforces this bullish trend. Complementing this positive scenario, the Moving Average Convergence Divergence (MACD) indicators remain in the bullish zone, as evidenced by the green lines intersecting in the histogram.


