


- Bitcoin’s breakout above $69,330 could target $74,400, with key Fibonacci resistance at $69,322.41.
- The symmetrical triangle pattern suggests a decisive move, indicating potential trend continuation.
- Technical indicators for Bitcoin show mixed signals, implying short-term pressure.
Bitcoin seems poised for a significant move as it breaks out from a symmetrical triangle pattern, as highlighted by Ali Martinez, a top analyst. Recently, Bitcoin has been trading within a symmetrical triangle pattern on the hourly chart against the US Dollar on the Coinbase exchange.

This pattern, characterized by converging trend lines of lower highs and higher lows, typically signifies a period of consolidation before a potential breakout. Traders are closely monitoring the key resistance level of $69,330. A sustained close above this level could propel Bitcoin towards the next major target of $74,400.
The symmetrical triangle pattern suggests Bitcoin is gearing up for a decisive move. This pattern indicates the continuation of the existing trend, although it can break out in either direction. The current technical analysis shows Bitcoin at a critical juncture, where the price movement will likely determine its short-term trajectory.
Fibonacci retracement levels play a crucial role in this analysis, highlighting potential support and resistance zones. The initial support level is the 0.236 retracement at $67,274.97. If Bitcoin drops below this level, it may signal further bearish momentum.
Top Cryptos Rally as Bitcoin Approaches $69K and BNB Eyes New ATHThe 0.382 retracement level at $68,050.96 offers a stronger support base, potentially halting downward movements and providing a foundation for a bullish rebound. The 0.5 retracement level at $68,683.39 is a critical zone often considered a strong support and resistance area.
At press time, Bitcoin is trading around the 0.618 retracement level at $70,229, up 3.21% in the last 24 hours.
This level is significant resistance; breaking above it might indicate a bullish breakout. If this occurs, the next resistance level is the 0.786 retracement at $70,242.48, which poses a high resistance before reaching the full retracement level of $71,432.17.
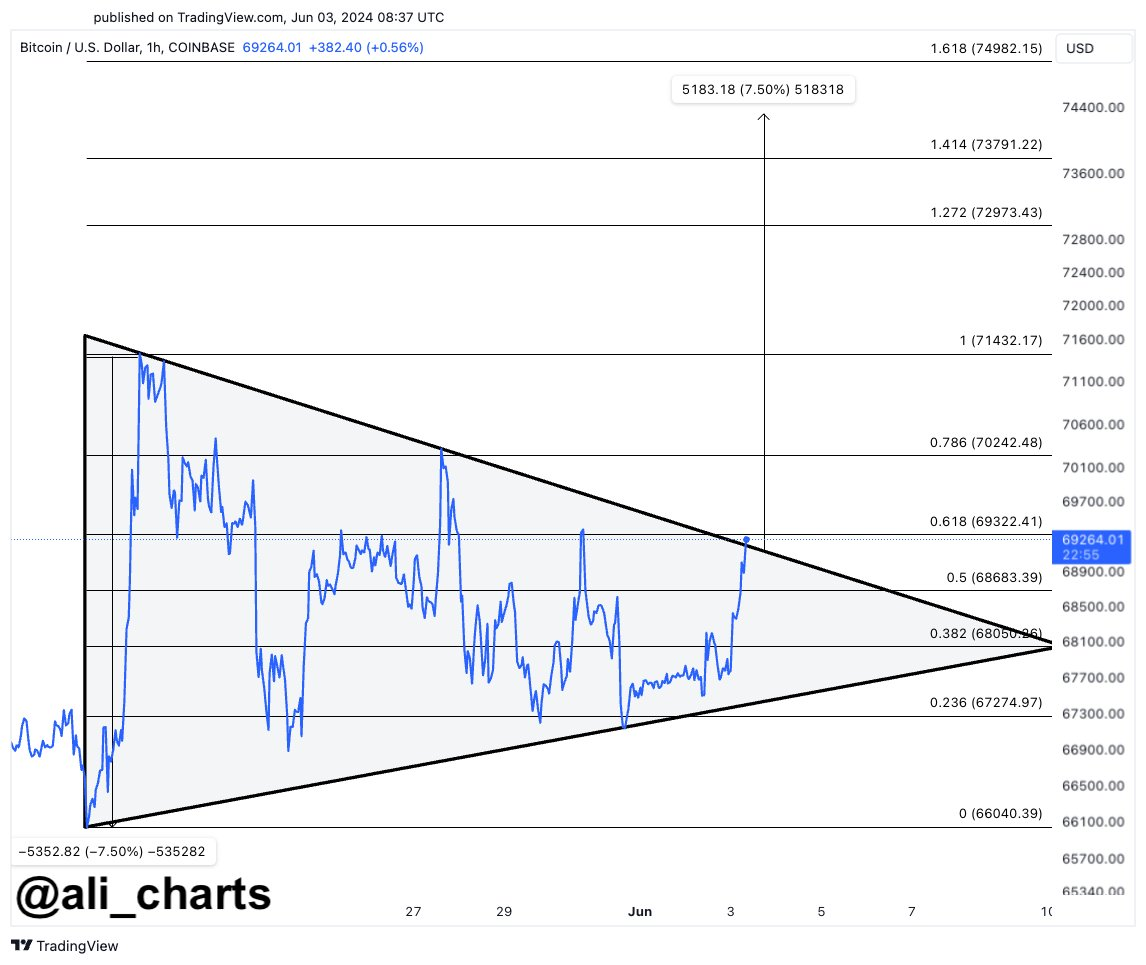
If Bitcoin successfully breaks out above the upper boundary of the symmetrical triangle, Fibonacci extension levels provide potential upward targets. The 1.0 extension level at $71,432.17 is a critical psychological and technical resistance point where the price might consolidate.
Beyond this, the 1.272 extension level at $72,973.43 offers the next significant resistance, providing a medium-term target for bullish traders. The 1.414 extension level at $73,791.22 and the 1.618 extension level at $74,982.15 represent further upside potential, suggesting a continuation of bullish momentum.
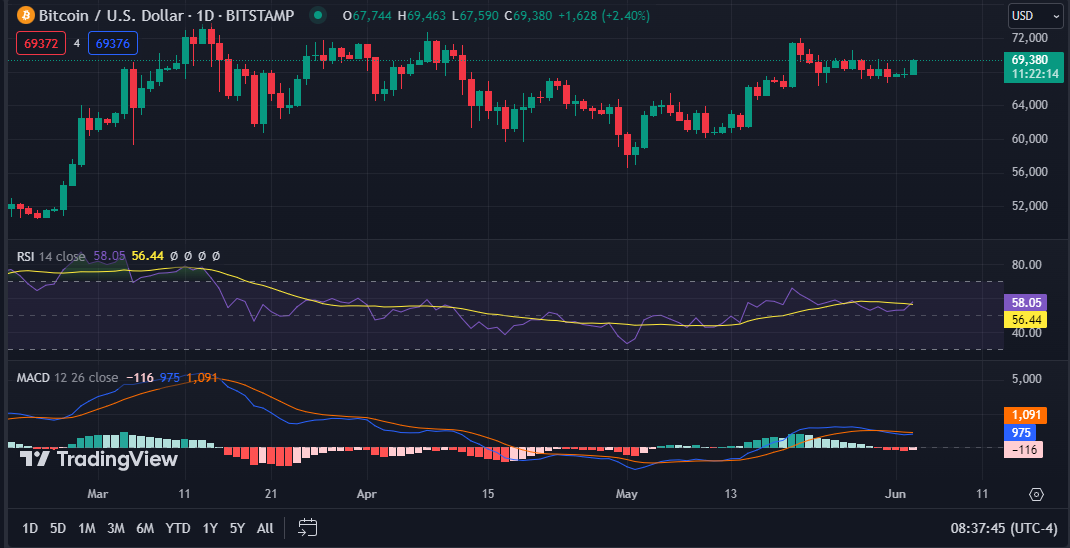
In terms of technical indicators, Bitcoin’s 1-day Relative Strength Index (RSI) is at 57.33, indicating a neutral trading zone. The Moving Average Convergence Divergence (MACD) is below the signal line at 958.5, suggesting short-term downward pressure on the price.


