


- Bitcoin’s price movements show a pattern of post-halving increases, stabilizing before the next surge.
- Halving events are pivotal, aligning closely with the start and peak of Bitcoin bull market cycles.
- Future predictions place Bitcoin’s next bull market peak in late 2025, potentially reaching up to $150,000.
Bitcoin, a premier digital asset, has seen varied price actions over its history. Recently, renowned crypto analyst Peter Brandt shared insights on X that suggest a compelling future for Bitcoin.
Brandt’s analysis, using historical data, charts the price fluctuations linked to Bitcoin halving events. These occur roughly every four years, cutting mining rewards in half and influencing the market.
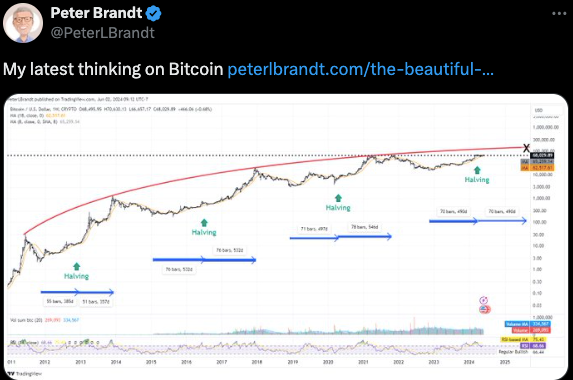
Starting in 2011, Bitcoin’s market activity was relatively quiet until gaining momentum before the first halving in 2012. Brandt’s chart illustrates a recurring pattern where Bitcoin prices climb after each halving. This pattern often peaks before stabilizing and retracting slightly. The interval between each halving and the subsequent price peak has increased over the cycles.
The unique aspect of Brandt’s analysis is the symmetry that is pointed out in the bull market cycles. The number of weeks from the start of each cycle to the halving is nearly identical to the time from the halving to the market’s peak. This observation could be pivotal for future forecasts.
Looking forward, if the pattern holds, the next peak in the bull market cycle is projected for late August or early September 2025. Brandt speculates that Bitcoin could reach between $130,000 and $150,000. This prediction is mapped on an inverted parabolic curve, marked on his chart with an X to denote the likely date and price.
Over the past 24 hours, Bitcoin has witnessed a notable increase in its market value, climbing by 2.52% to $69,088. This surge has pushed the cryptocurrency’s market capitalization to approximately $1.36 trillion.
A significant spike in trading volume accompanied the price rise. The volume soared by over 109%, totaling around $24.23 billion in the last day. This increase in volume indicates a heightened interest and activity in Bitcoin trading.
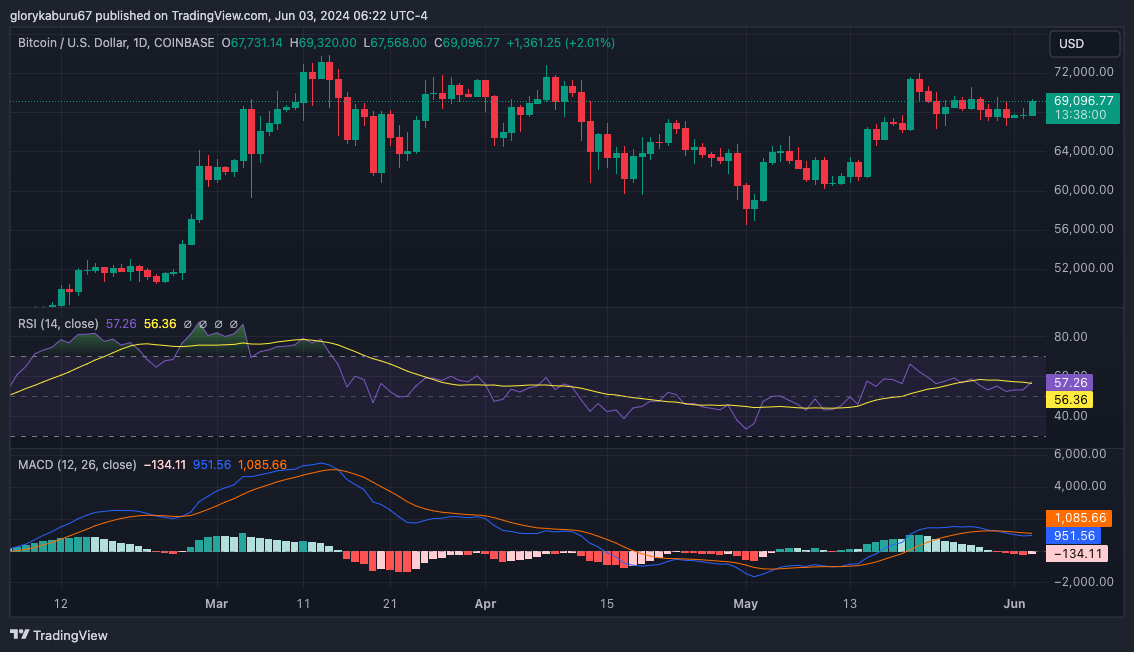
The 24-hour technical indicators for BTC have shown promising signs of potential gains. The Relative Strength Index (RSI) remains steady at 57. This value suggests that Bitcoin is neither overbought nor oversold, providing a neutral ground for potential investors.
Furthermore, the Moving Average Convergence Divergence (MACD) exhibits a narrowing gap between the MACD and signal lines. This indicates a possible bullish crossover soon.


