
According to renowned crypto analyst Michaël van de Poppe, Bitcoin seems to be gearing up for another significant move. The digital currency is in a consolidation phase, potentially building up strength before attempting to break out to new levels. His analysis points to an imminent decision point for the market’s trajectory.
Despite some bearish divergence signals, the price has not broken below a critical support level, which might suggest that Bitcoin is mustering the necessary momentum for another upward movement. Van de Poppe highlights a primary area for a potential low on this correction, suggesting that if Bitcoin does not fall below this zone, it could be set for a rise, with the caveat that it must first break above the $70.3K mark to invalidate the bearish thesis.
Simultaneously, gold has been making headlines with its rally as the precious metal continues its climb toward new all-time highs. This traditional safe-haven asset often moves inversely to market sentiment, and its rise may indicate a broader search for stability among investors, which could play a key role in Bitcoin’s next steps.
As of press time, Bitcoin is exhibiting a bearish trend observed in the broad market. BTC is trading at $70,660, down by 0.10% in the past 24 hours. Over the past week, it has gained over 6%, while the monthly chart shows a decline of 1% as the BTC battles the $73k resistance level.
Bitcoin has been trading in a tight range since the start of today’s session as bulls and bears battle for control. An immediate resistance has been observed at the $71,200 level, while support is seen at the $69,500 level. The market capitalization has declined to $1.39 trillion, while the trading volume has seen a significant decline of 20%, with a value of $29 billion.
Looking at the technical indicators, BTC displays a neutral market sentiment. The Moving Average Convergence Divergence (MACD) indicator shows signs of imminent crossover as the MACD line trends relatively with the signal line. The histogram remains neutral as well as the green and red bars fade away.
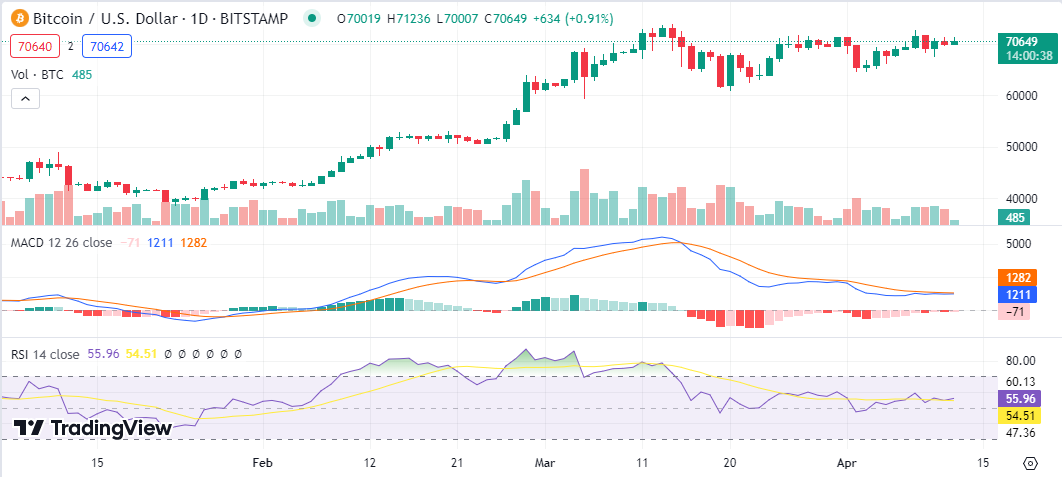
In addition, the 20-day Exponential Moving Average is currently below the current price at $68,928, providing key support for the bulls to push BTC upwards. The Relative Strength Index (RSI) is currently at the 55 index at the neutral region. The buying pressure needs to increase to push the RSI upwards toward the overbought region, which could send BTC toward the previous highs of 73k.