Despite a decent start in 2023, the Bitcoin price is showing signs of weakness both fundamentally and technically. BTC had a rough patch throughout 2022 amid a broader cryptocurrency rout. The prominent digital asset has depreciated by almost 64% from the mark of $46,700. The market capitalization plunged from $900 billion approx. on January 1, 2022, to end the year with around $320 billion. As of writing, BTC/USD is exchanging hands at $17,100, up 0.43% for the day.
One of the prominent predictions for the Bitcoin price in 2022 is predicted by the developer of Bitcoin Stock-to-Flow (S2F), Plan B. As per his analysis, the price could test $110,000 in December 2022. However, the price ended 85% off the target.
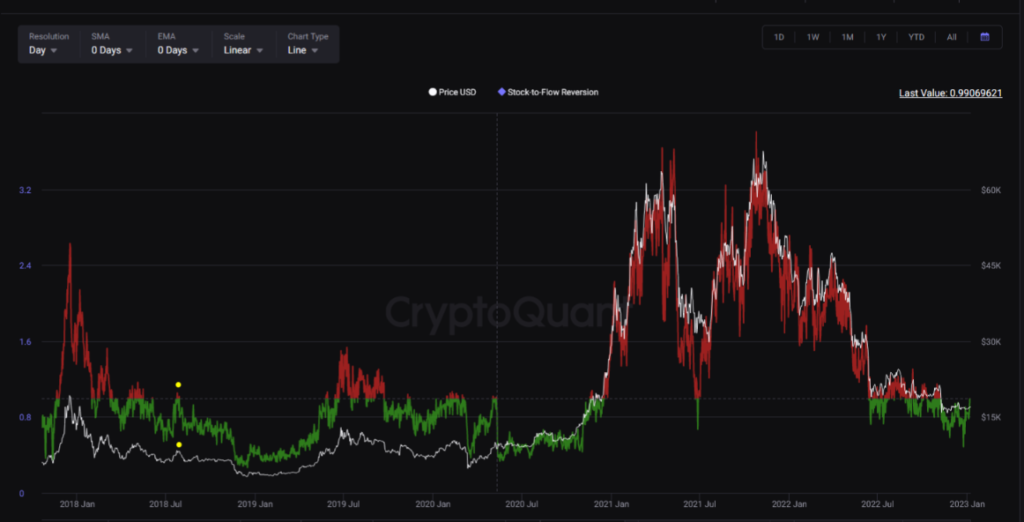
Bitcoin price might decline all the way down to $16,700 during this bear market as per CryptoQuant, an analytic firm.

Gigisuvlian, an analyst with Cryptoquant predicted that Bitcoin’s Stock to Flow Reversion is indicating that BTC could see more downside toward $16,700. The eyes will be on the U.S. Consumer Price Index (CPI) to be released this week which could highlight the kind of recession, and 2023 could be worse than 2022.
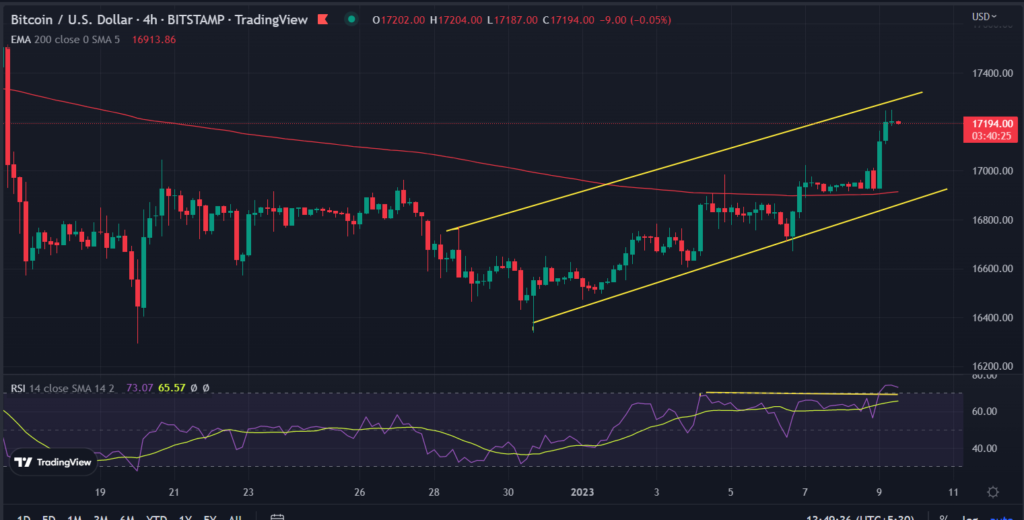
Bearish RSI divergence on a 4-hour time frame suggests a price correction
Bitcoin price trades inside the “Rising Wedge” pattern, a bearish continuation technical formation. In the recent move, the price overstepped the short-term resistance zone of $16,920.

In the 4-hour time frame, BTC breached the critical 200-day EMA with strong upside momentum as seen with the green candlesticks. However, it would be interesting to watch how long the bulls would be able to sustain above the level.
But, the bearish RSI divergence points to a probable price correction on the cards. Any downtick in the indicator would mean further downside targets toward $17,000 and $16,800.
On the flip side, a daily close above $17,100 would invalidate the bearish outlook at least in the short term. Bulls could target $17,200 as the upside target next. Further, additional buying pressure could see a jump toward $17,350-$17,400.


