


- Crypto analyst NebraskanGooner identifies Bitcoin highs and lows through sentiment analysis.
- Bitcoin’s first quarter typically shows robust growth, surpassing expectations with impressive gains.
- Despite strong starts annually, Bitcoin often struggles to maintain momentum into Q3.
Bitcoin, a leading cryptocurrency, has shown notable price volatility recently, as pointed out by crypto analyst NebraskanGooner on his X post. His analysis, presented through a detailed monthly candlestick chart, captures the dramatic shifts in Bitcoin’s market sentiment over several years.
The chart identifies key moments of “Max Euphoria” and “Max Fear,” representing the highest and lowest points of investor sentiment.
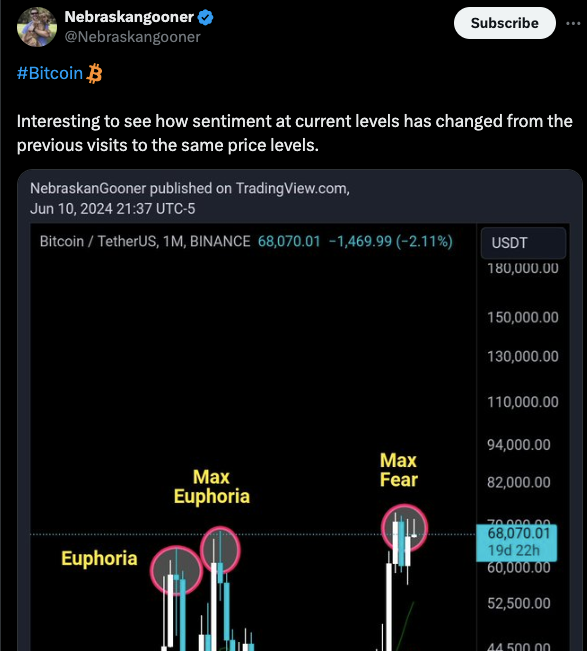
During periods labeled “Max Euphoria,” investor confidence surged, significantly driving up Bitcoin prices. These peaks are marked by heightened trading activity and optimism. On the flip side, the “Max Fear” points on the chart signify substantial market sell-offs, occurring when investor anxiety is palpable and widespread.
In another development, crypto analyst Ali shared insights on Bitcoin’s performance in a detailed X post. The data showcased Bitcoin’s journey with its fluctuating quarterly returns from 2013 to 2024.
Ali’s chart illustrated that Bitcoin kicked off 2024 with an impressive 68.68% gain in Q1, followed by a slight 0.19% decrease in Q2. Typically, Bitcoin’s first quarter shows robust growth, boasting an average return of 56.47%. In contrast, Q3 generally sees a dip, with an average loss of 2.57%.
In 2023, Bitcoin began strongly with a 71.77% increase in Q1 and continued to climb in Q2. However, it faced a significant 11.54% reduction in Q3. The year 2020 stands out, as Bitcoin surged by a remarkable 168.02% in the final quarter.
The data from 2024 continues to follow the trend of strong starts but faces challenges in maintaining momentum through the year. Historically, Q3 has been tough for Bitcoin, showing a median return of -2.57% despite an average gain of 6.49%.
Bitcoin Consolidation Near ATH Sparks Potential Market ExpansionBitcoin price has seen significant fluctuations over the past day. The leading cryptocurrency started at a high, maintaining steady growth before experiencing a sharp decline. At press time, Bitcoin is trading at $67,650 down 2.54% in the last 24 hours.
Market dynamics show a marked increase in trading volume, up 94.62% from the previous day, totaling $28,756,217,031. This surge indicates heightened activity among traders and could signal potential shifts in investor sentiment and market stability.
Despite the downturn, Bitcoin’s market capitalization remains strong at approximately $1.33 trillion, experiencing a slight dip of 2.53%.
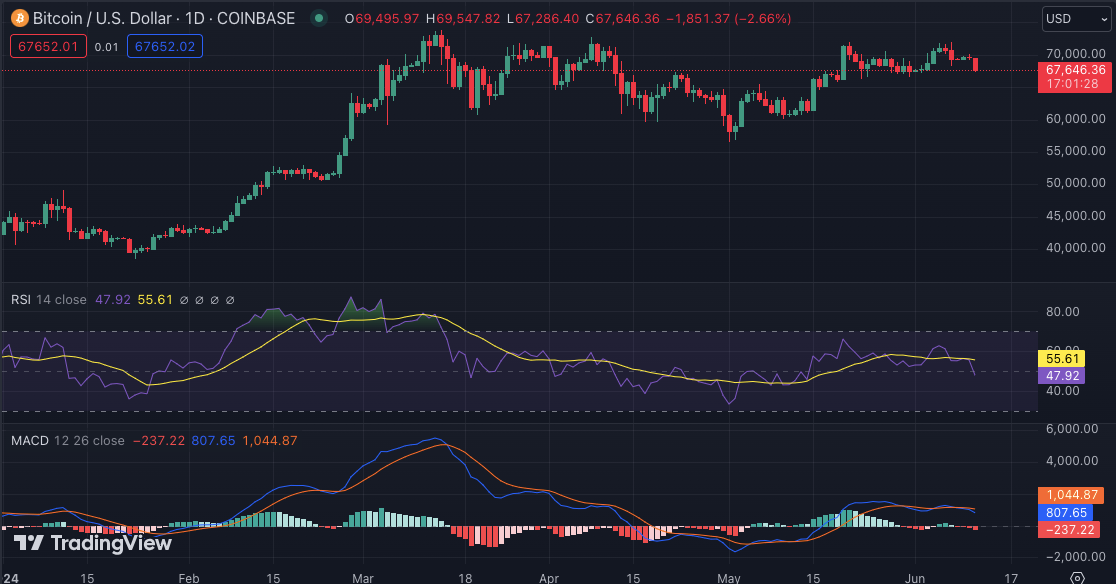
The technical indicators for Bitcoin reveal notable trends in its recent market behavior. The Relative Strength Index (RSI) hovered around 47, indicating a neutral momentum. Concurrently, the Moving Average Convergence Divergence (MACD) appears to diverge negatively, suggesting a potential decrease in bullish momentum.


