


- Bitcoin’s positive sentiment has plummeted, with social mentions down to a third of four months ago, hinting at bearish outlooks.
- Increased short positions on Binance and a 0.90% daily price drop suggest a bearish sentiment.
- BTC RSI at 58.85 and MACD above the signal line indicate neutral to bullish momentum despite current bearish trends.
Bitcoin has seen a significant drop in positive commentary despite a recent mid-sized bounce in the cryptocurrency market, as highlighted by Santiment, a top analytic firm. This shift in sentiment was noticeable among traders on Binance, where many are opening short positions in anticipation of another price decline. This growing bearish sentiment, combined with the increase in short positions, could paradoxically set the stage for a potential rise in Bitcoin’s price.

Positive social media mentions of Bitcoin have decreased to about one-third of what they were four months ago. This decline in sentiment coincides with an increase in traders betting against Bitcoin, as evidenced by rising funding rates. This trend indicates that many market participants are expecting Bitcoin to drop further. However, such a widespread bearish outlook often precedes a price reversal as market dynamics shift to balance the sentiment.
Bitcoin Holders Drop Dramatically: Is This a Sign of Market Capitulation?Market analysts point out that a real bull run typically begins with a surge in buying volume from retail investors. CryptoQuant contributor Minkyu Woo noted that significant retail investor participation usually boosts market sentiment. Currently, this uptick in retail buying has not been observed, suggesting that the market might not yet be primed for a substantial upward movement.

As of press time, Bitcoin was trading at $64,170.35. The immediate support level is around $63,500, while the immediate resistance is around $64,500. Major support lies at approximately $63,000, and major resistance is just above $65,000.
The current price trend indicates a downtrend within the day, with a 0.90% decrease. Trading volume over the past 24 hours has also decreased by 14.54%, indicating reduced activity.
Chart analysis reveals that Bitcoin reached a high of around $64,690 before declining. The price faced resistance at $64,500 and briefly dipped below $64,000. However, the $64,000 level could be a resistance because the price recovered shortly from there. This suggests some support in the $64,000 region. Overall, the daily trend shows multiple attempts to break the $64,500 resistance, which have been unsuccessful so far.
If Bitcoin can break through the $64,500 resistance and sustain above this level, it might test the higher resistance around $65,000. This would require strong buying pressure to maintain upward momentum. Conversely, if the price fails to hold above $64,000, it could retest the major support around $63,000.
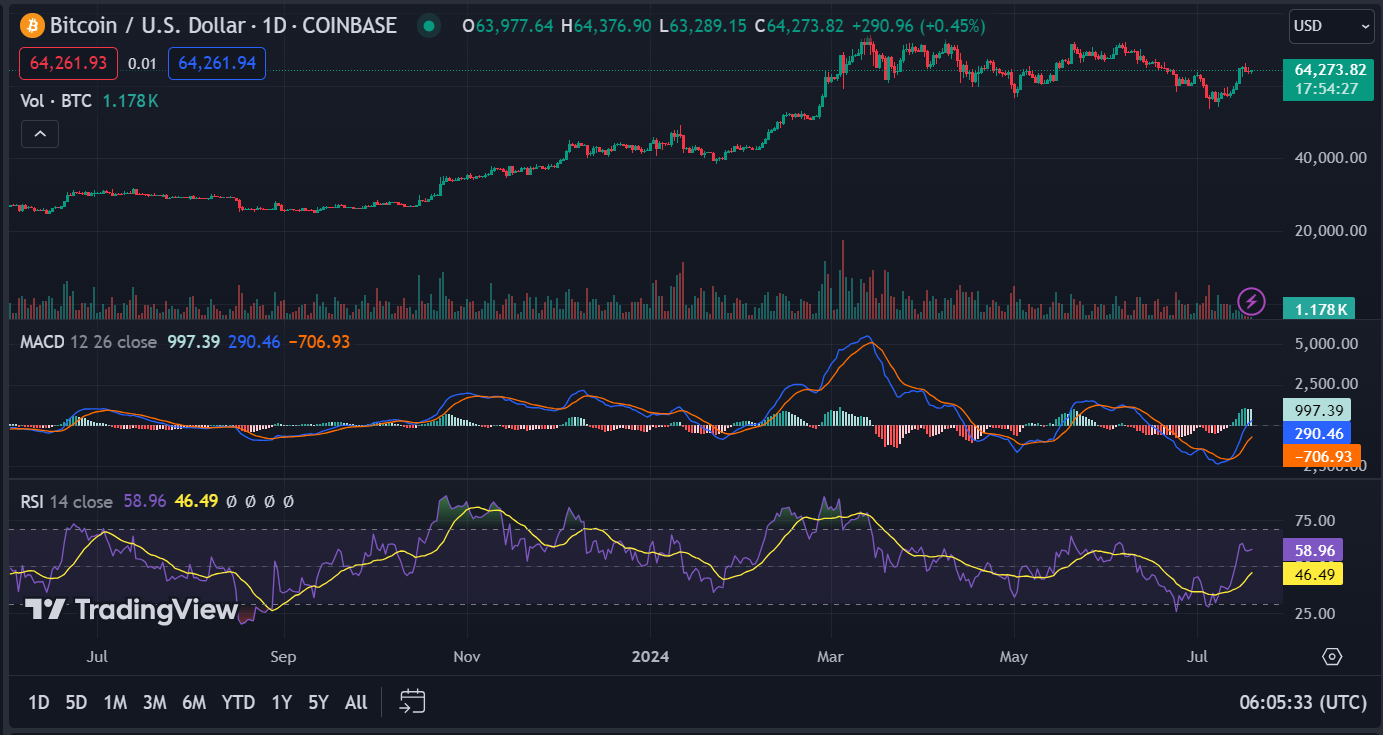
Bitcoin’s 1-day RSI stands at 58.85, indicating that the market is neither overbought nor oversold. Additionally, the 1-day MACD trading above the signal line suggests bullish momentum in the market.


