


- Bitcoin’s current range is stagnant, and a decisive break from support or resistance is crucial for the next move.
- A potential double top pattern and loss of 11 EMA support suggest Bitcoin could test $62,000 if current levels fail.
- With a 1-week RSI at 57.43 and MACD below the signal line, Bitcoin may face short-term bearish pressure if support breaks.
Bitcoin’s recent price action has left many traders on edge as it drifts in the middle of its trading range. As highlighted by Nebraskangooner, an analyst, after retesting the base of double bottom support and the Gooner EMA, Bitcoin’s movement has become stagnant.

Currently, Bitcoin is grappling with a potential double-top formation. This pattern could signal a bearish reversal, especially as the price struggles to maintain support from the 11 EMA. Further noted by Nebraskangooner, the critical level to watch is the red Gooner EMA, which aligns with significant horizontal support. Should Bitcoin fall below this support level, a measured breakdown target could drive the price towards the $62,000 range.

Examining the daily Bitcoin (BTC) price against Tether (USDT) from Binance reveals a few key levels to consider. The upper yellow horizontal line represents a resistance level of around $67,500. This zone has consistently rejected price advances, indicating strong selling pressure. Conversely, the lower yellow line marks a support level near $65,000, which has provided recent support and coincides with the 22-day Exponential Moving Average (EMA 22).
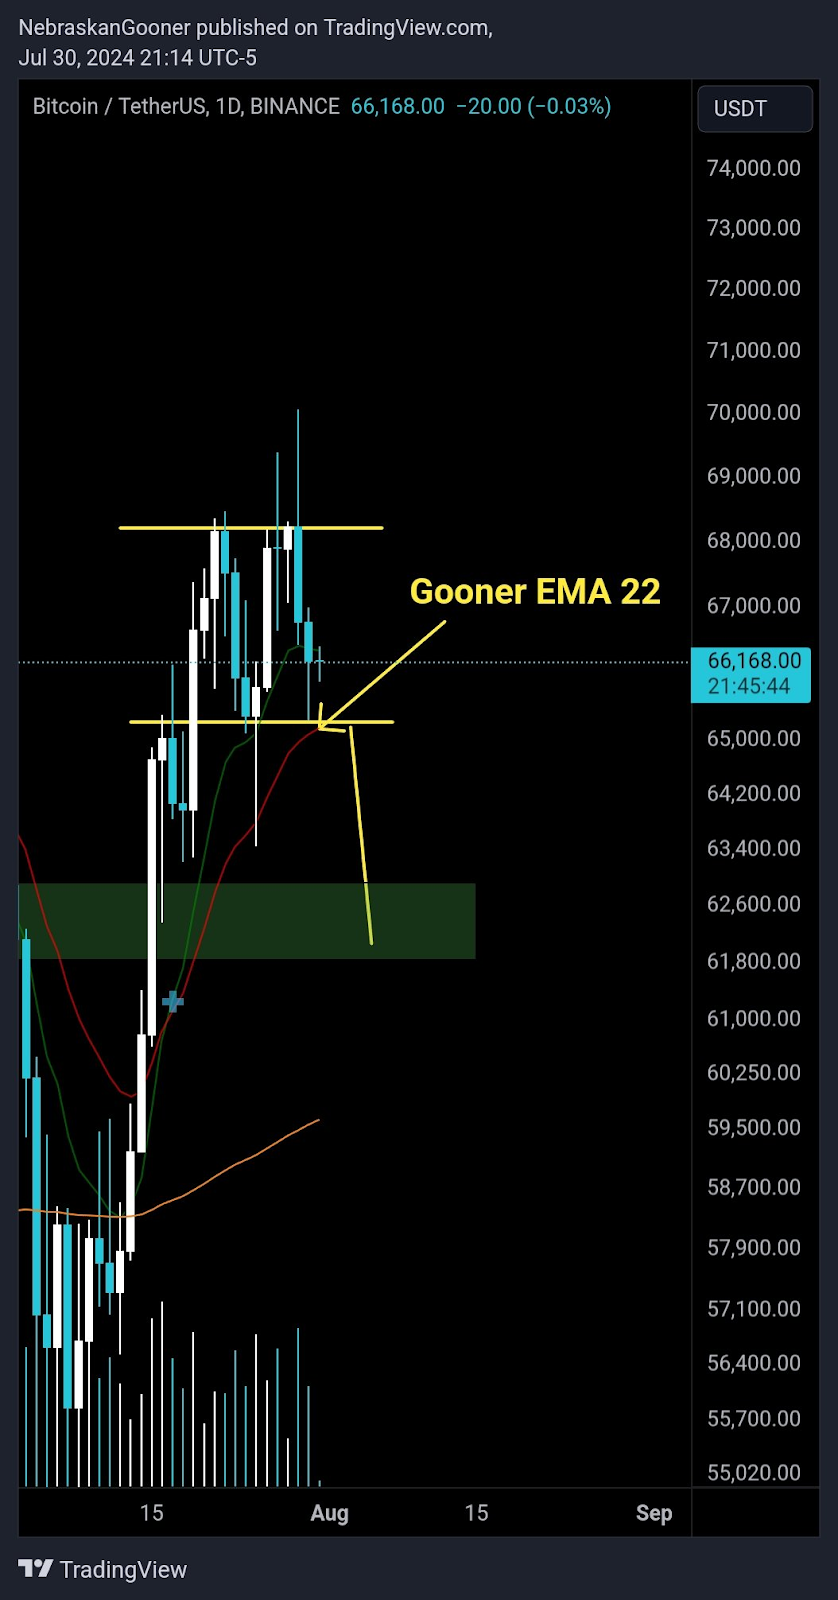
The EMA 22 currently stands as a pivotal support level. If Bitcoin holds above this EMA, it could suggest a potential rebound. However, a break below this EMA likely indicates further decline. In such a scenario, the next significant support area appears to be around $62,000, a level previously tested and highlighted by a green-shaded region on the chart.
Trump Raises $21M at Bitcoin 2024 Conference, With a $844,600 Per Person MeetingBitcoin’s price experienced a slight downturn today, closing at $66,294 at press time, marking a 0.81% decline over the past 24 hours. The cryptocurrency’s market capitalization followed suit, decreasing by 0.80% to reach approximately $1.31 trillion.
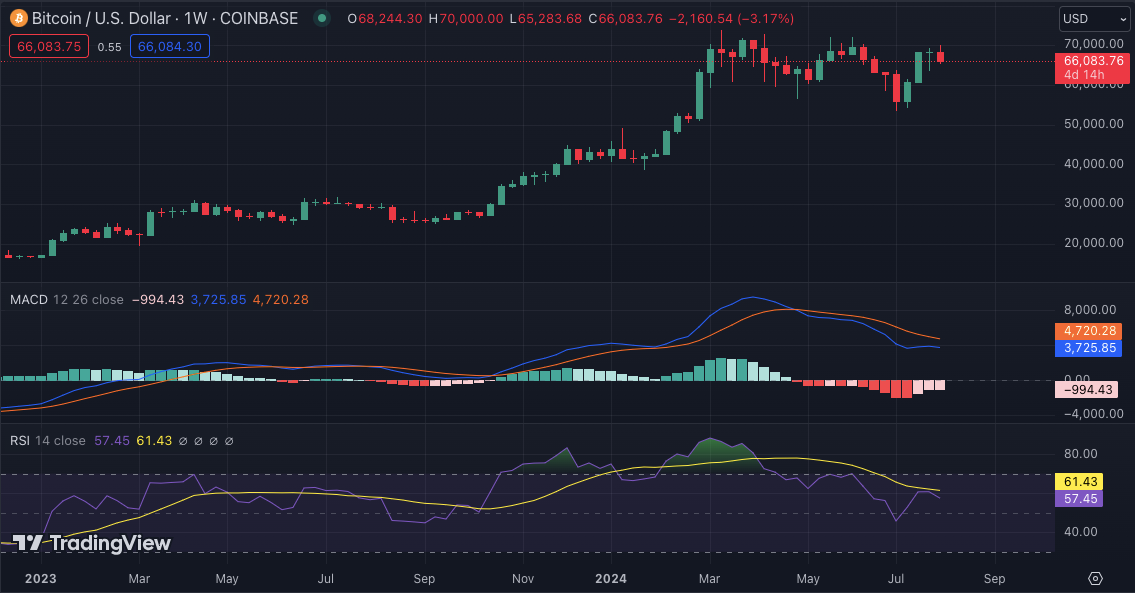
The weekly chart for Bitcoin against the U.S. dollar shows that the cryptocurrency has experienced considerable fluctuations in price. The Moving Average Convergence Divergence (MACD) shows a slight bearish crossover as the signal line crosses above the MACD line. The RSI (Relative Strength Index) is currently at 57.45, nearing the upper end of the neutral range.


