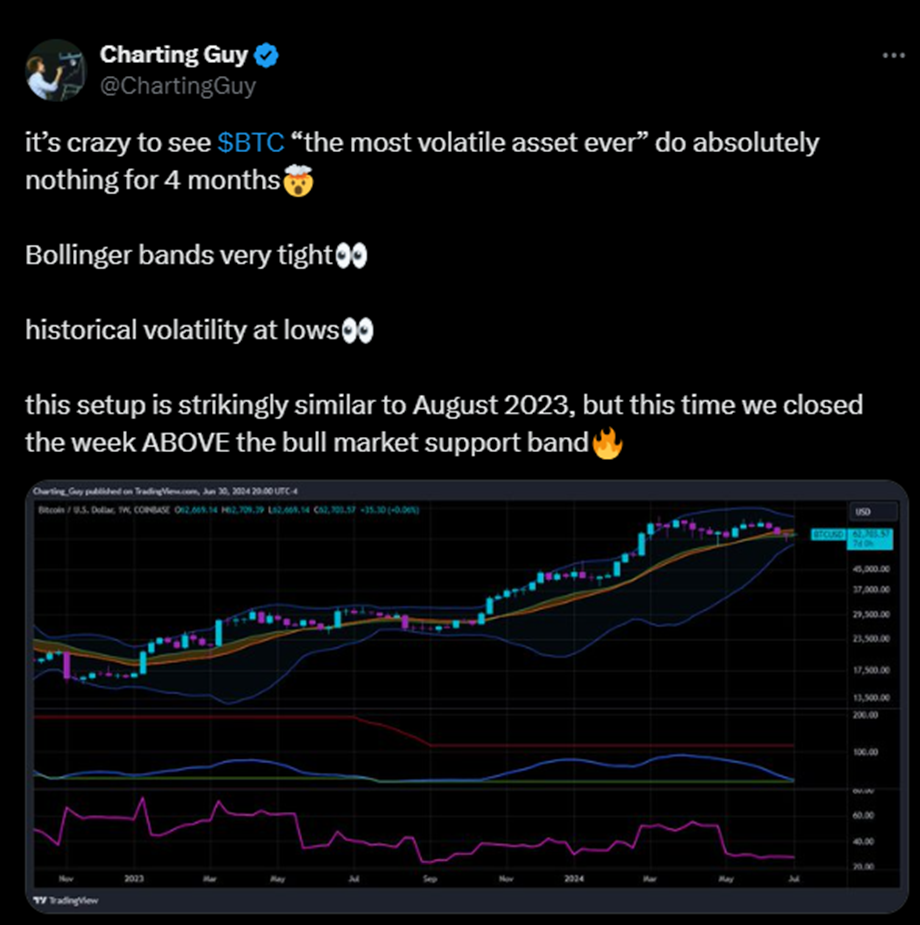
- Bitcoin’s low volatility resembles August 2023, but a weekly close above the bull market support band is bullish.
- Key support levels at $45,000 and $55,000 hold firm, while resistance at $65,000 and $70,000 may face selling pressure.
- RSI between 50-60 suggests room for Bitcoin’s price to rise further without being overbought.
Bitcoin, often known as the most volatile asset, has remained unusually stable over the past four months. As per analysis by Charting Guy, an analyst, the Bollinger Bands, which measure volatility, have become very tight. Historical volatility has reached low levels, indicating a lack of significant price movements. This setup is reminiscent of August 2023. However, this time, Bitcoin’s weekly candle has closed above the bull market support band, a bullish sign.
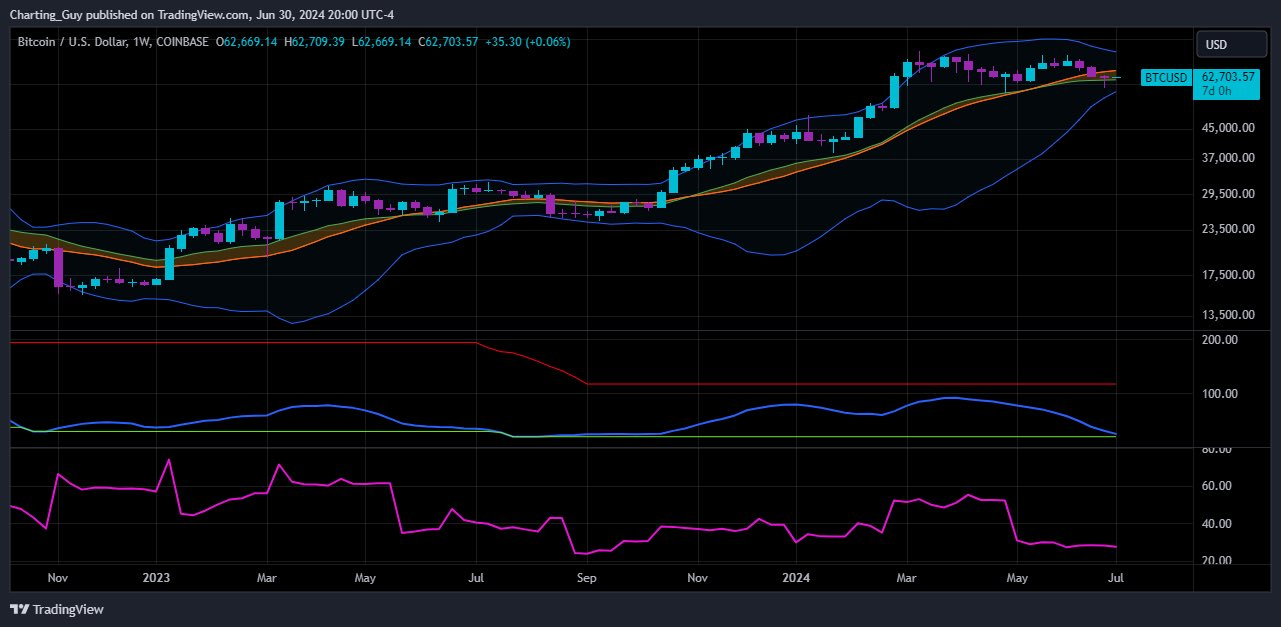
As further noted by Nebraskangooner, another leading analyst, Bitcoin is holding key support levels with 1.5 hours left until the weekly and monthly candle close. The price is near the upper Bollinger Band, indicating it is relatively high although it is not necessarily overbought. The Bollinger Bands widened earlier in 2023, reflecting increased volatility and a substantial price rise. The current tightness suggests a period of low volatility.

The 20-week simple moving average (SMA), which forms the middle line of the Bollinger Bands, and a longer-term SMA (likely the 50-week or 200-week), both show an upward slope. This consistent upward movement reinforces the bullish trend and confirms long-term positive momentum.
The $45,000 level, aligned with the lower Bollinger Band, acts as crucial support. Historically, Bitcoin has rebounded from this zone during corrections.
Additionally, $50,000 has served as psychological support during price consolidations and minor corrections throughout 2023. The $55,000 level provided strong support during early 2024’s correction.
On the resistance side, the recent high around $65,000 acts as immediate resistance. Breaking above this level could signal a continuation of the bullish trend. The $70,000 level presents another psychological barrier, where previous attempts to surpass it faced selling pressure. If Bitcoin breaks $70,000, the next resistance level is anticipated around $75,000, which might encounter significant profit-taking.
Understanding Bitcoin Halving: Historical Impact and Future Market PredictionsThe Relative Strength Index (RSI) also offers valuable insights. Currently, the RSI hovers around the 50-60 range, below the overbought threshold of 70. This suggests that while the market remains bullish, it is not overbought. Consequently, there is room for further upside.
As at press time, the live Bitcoin price is $63,369.32, with a 24-hour trading volume of $21,484,124,150. Bitcoin has risen 4.43% in the last 24 hours.