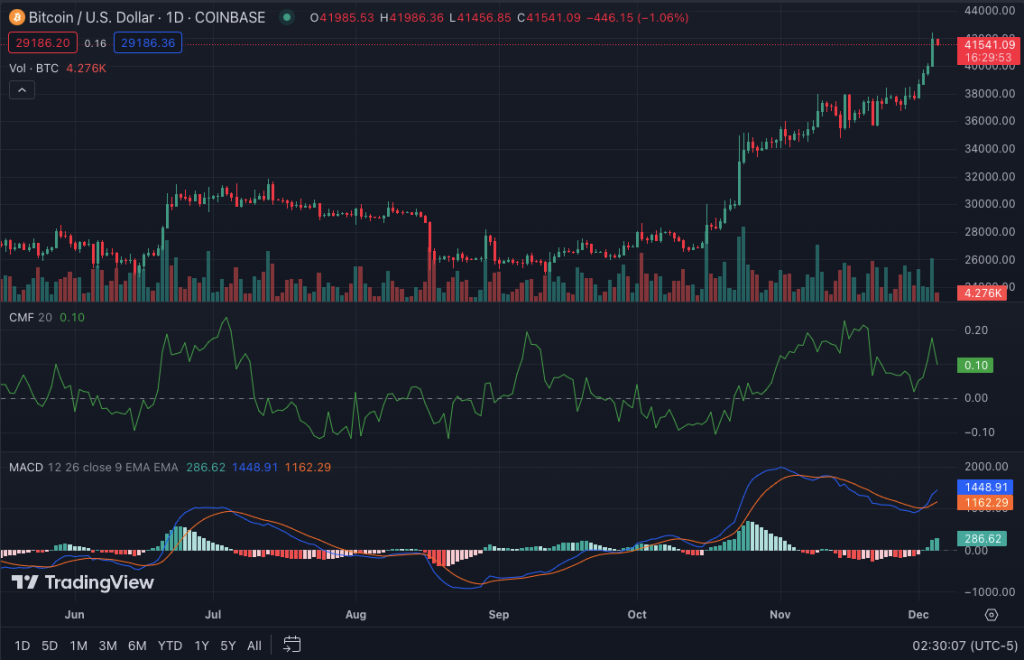
- Bitcoin’s recent ascent over $40,000, coupled with a high RSI, hints at a continued bullish trend and investor confidence.
- Despite Bitcoin’s RSI suggesting overbought conditions, the cryptocurrency’s steady rise indicates strong market liquidity and interest.
- The break of Bitcoin’s $42,371 resistance level could pave the way for further gains, with $50,000 as a potential target.
Bitcoin has recently experienced a notable surge, surpassing the $40k mark. This upward trajectory in Bitcoin’s value has sparked considerable interest within the trading community, particularly as the BTC/USD pair currently trades at $41,701. This represents a modest increase of 0.53% in the last 24 hours. Bitcoin’s market capitalization has soared, now exceeding $816 billion, thus reinforcing its position as the foremost cryptocurrency in terms of market value.
This uptrend in Bitcoin’s price is further underscored by a significant boost in trading volume, which currently stands at $3131 billion, with an increase of more than 40% over the past 24 hours. This surge in volume signals strong buying pressure from investors and an increased demand for BTC tokens. The circulating supply of Bitcoin is also a crucial factor in this uptrend, with $19 million BTC tokens currently circulating out of the total supply of 21 million.
Santiment, a platform with on-chain and social metrics for cryptocurrencies, shared a Twitter post providing the latest insights on the BTC market:
One of the critical factors underpinning this trend is Bitcoin’s Relative Strength Index (RSI), a respected technical indicator recently incorporated into the Santiment feed. The RSI, currently at 76.5, indicates that Bitcoin is overbought. Generally, an RSI above 65 signals a higher likelihood of a price drop, while an RSI under 35 suggests a greater chance of a price rise. When the RSI hovers between 35 and 65, predicting price performance becomes more challenging.
Despite these indicators, Bitcoin’s recent performance has been quite bullish. The cryptocurrency has successfully breached a significant resistance level at $42,371. This breakthrough could potentially foster further price increases in the short term. Bitcoin might reach or even exceed the $50,000 mark in the ensuing weeks if the bullish momentum persists.
Conversely, should bearish trends prevail, the immediate support level for Bitcoin would be around $40,000, followed by a critical psychological threshold at $35,000. However, given the current RSI levels and market dynamics, Bitcoin appears poised to maintain its upward trajectory, possibly surpassing the anticipated $50,000 benchmark.

Adding Bitcoin’s technical indicators to the daily price chart reveals that the market is indicating a buy signal, and the trend might continue to favor bulls. The moving average convergence divergence (MACD) is currently in a bullish crossover, with the MACD line crossing above the signal line. The histogram is also positive, indicating a strong momentum for BTC. The Chaikin money flow (CMF) indicator, a volume-based momentum oscillator, has also turned bullish, suggesting a positive inflow of funds into the market.


