
- Holding above the support level of $67,500-$68,000 is crucial as it could spark a bullish momentum.
- Breaking $74,000 resistance might push Bitcoin towards $100,000, but failure risks a correction to $66,000.
- A bullish pennant on the weekly chart suggests a potential for a major rally if resistance levels are breached.
Bitcoin’s price history seems to be echoing past patterns, presenting an intriguing moment for traders. As per Crypto Rover, Founder of Cryptoseacom, the current situation mirrors historical trends, particularly with the formation of a bullish pennant or flag pattern on the weekly chart. This pattern often signals a continuation of the previous uptrend, potentially leading to another substantial rally.
Recent support levels have been pivotal in shaping the market’s direction. The primary support is around $56,000, a key level that has provided stability during recent consolidations. Another notable support level is at $42,000, marking previous corrections. These levels are crucial as they represent areas where buying interest has historically been strong.
On the resistance side, Bitcoin is facing immediate resistance at approximately $74,000. This level aligns with the upper boundary of the current consolidation pattern. Additionally, a higher resistance at $99,000 represents a significant psychological and technical barrier.
Current trends reveal a period of consolidation with decreasing volatility, leading to a critical juncture. The bullish pennant formed after a strong uptrend suggests the potential for an upward breakout.
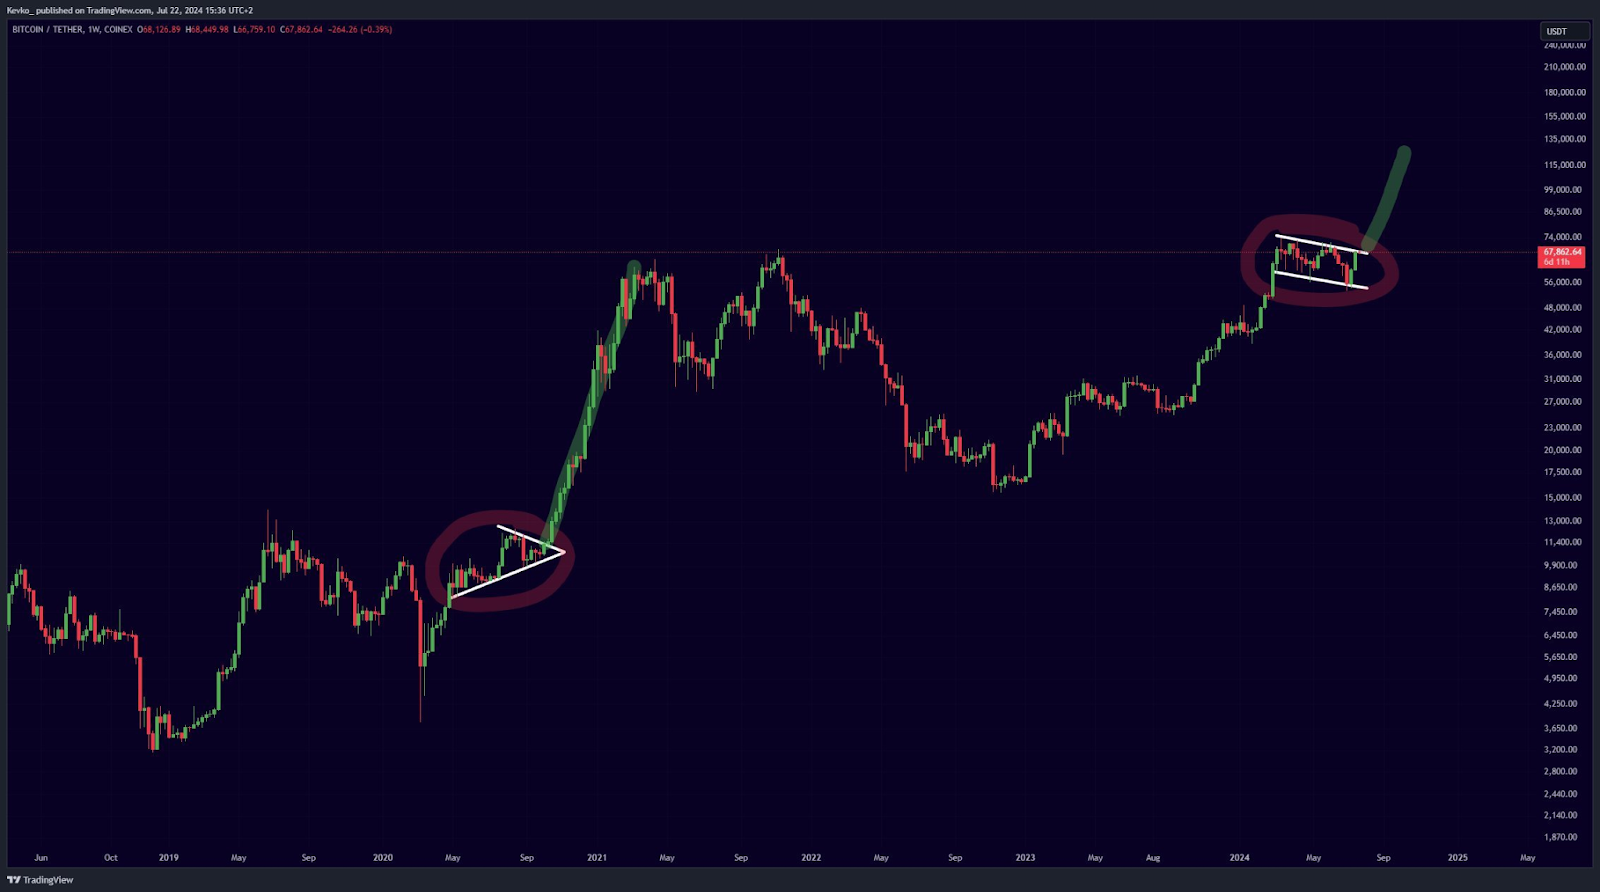
If Bitcoin manages to break above the $74,000 resistance with substantial volume, it could lead to a rapid ascent, potentially reaching the $100,000 mark or beyond. This projection is based on the measured move from the flagpole of the previous rally, which supports the possibility of significant upward momentum, although Crypto Rover further states that Bitcoin might be in a lot of danger.

Turning to the hourly timeframe as of July 23, 2024, Bitcoin is trading at around $68,013.5. The immediate support zone between $67,500 and $68,000 is crucial. This level has been tested multiple times and has consistently held, indicating strong buying interest.
Crypto Analysts Forecast Intriguing Months Ahead for Bitcoin InvestorsThe immediate resistance is $70,500, which needs to be breached for the bullish momentum to continue. Another resistance level is $69,300, which aligns with previous highs and presents an intermediate barrier.
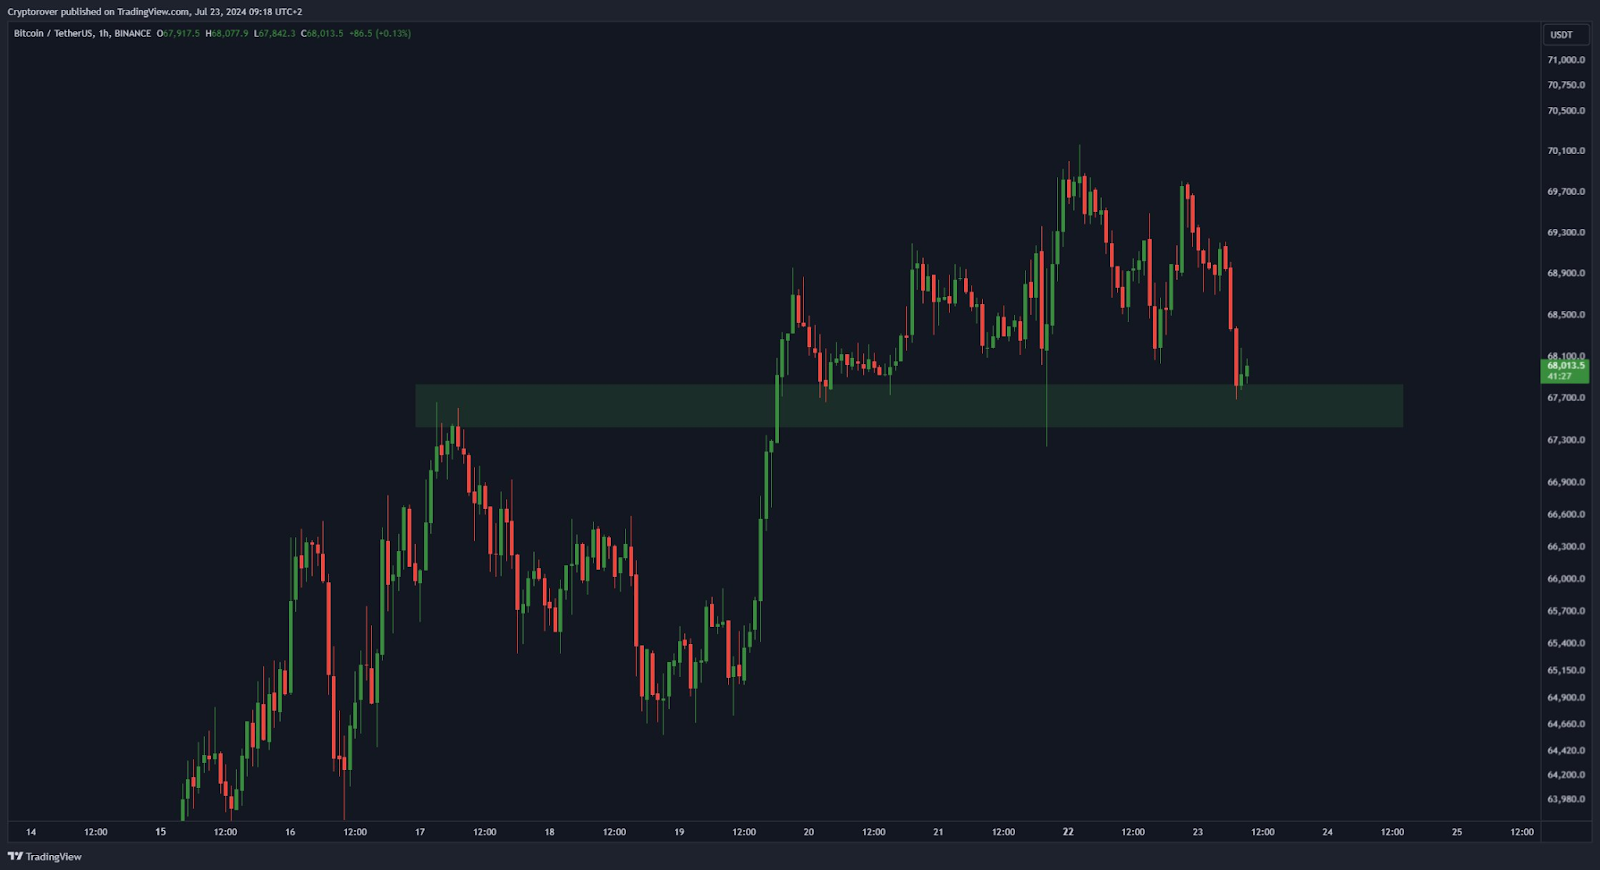
If Bitcoin holds above the $67,500 to $68,000 support zone and surpasses the $69,300 resistance, it could retest the $70,500 level. A successful breach here might signal further upside potential. Conversely, if Bitcoin fails to maintain the support zone, it could face a deeper correction, with $66,000 being the next significant support level.
The current price action is critical as it tests the strong support zone, and its reaction will likely determine the next major move. The live Bitcoin price today is $66,895.75, with a 24-hour trading volume of $43,889,702,187. Bitcoin is down 0.57% in the last 24 hours.