


- Bitcoin’s current uptrend could break the previous top of $69,040, aiming for potential new highs above $100,000.
- Immediate support at $54,000 and resistance near $69,040 are critical for Bitcoin’s next price movements.
- BTC’s RSI at 63.95 and MACD above the signal line indicate a neutral to bullish short-term trend.
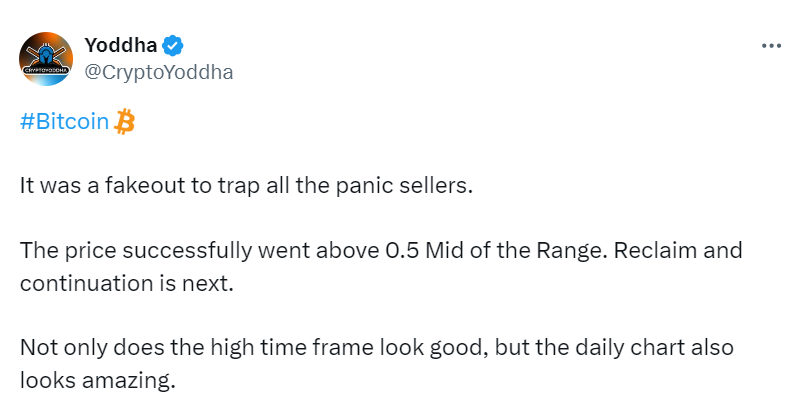
Bitcoin (BTC) recently experienced a fakeout aimed at trapping panic sellers, as highlighted by CryptoYoddha, an analyst. This move allowed the price to surge above the $60K level, which is the 0.5 midpoint of its trading range. As a result, a reclamation and potential continuation of this trend are expected. Both the high-time frame and daily charts suggest a promising outlook for Bitcoin.
A historical top is marked at approximately $69,040, while a significant bottom is identified at around $15,450. These levels define the boundaries of Bitcoin’s trading range, with the high near $69,040 and the low extending close to zero on a logarithmic scale. The midpoint of this range is around $32,000, acting as a crucial support and resistance level.
Crypto Analyst Predicts Bitcoin’s Surge Amid Market SignalsNoticeable correction phase shows a drop of $17,298.5, or -23.35%. Despite this correction, the trend analysis indicates a strong uptrend from the bottom of $15,450, characterized by higher highs and higher lows. Several correction phases, typically ranging between -21% to -23%, have occurred within this uptrend.
The chart suggests a possible future top between $110,000 and $120,000. Immediate support is identified around $54,000, aligning with previous corrections and mid-range levels. The next major resistance level is near the historical top of $69,040.
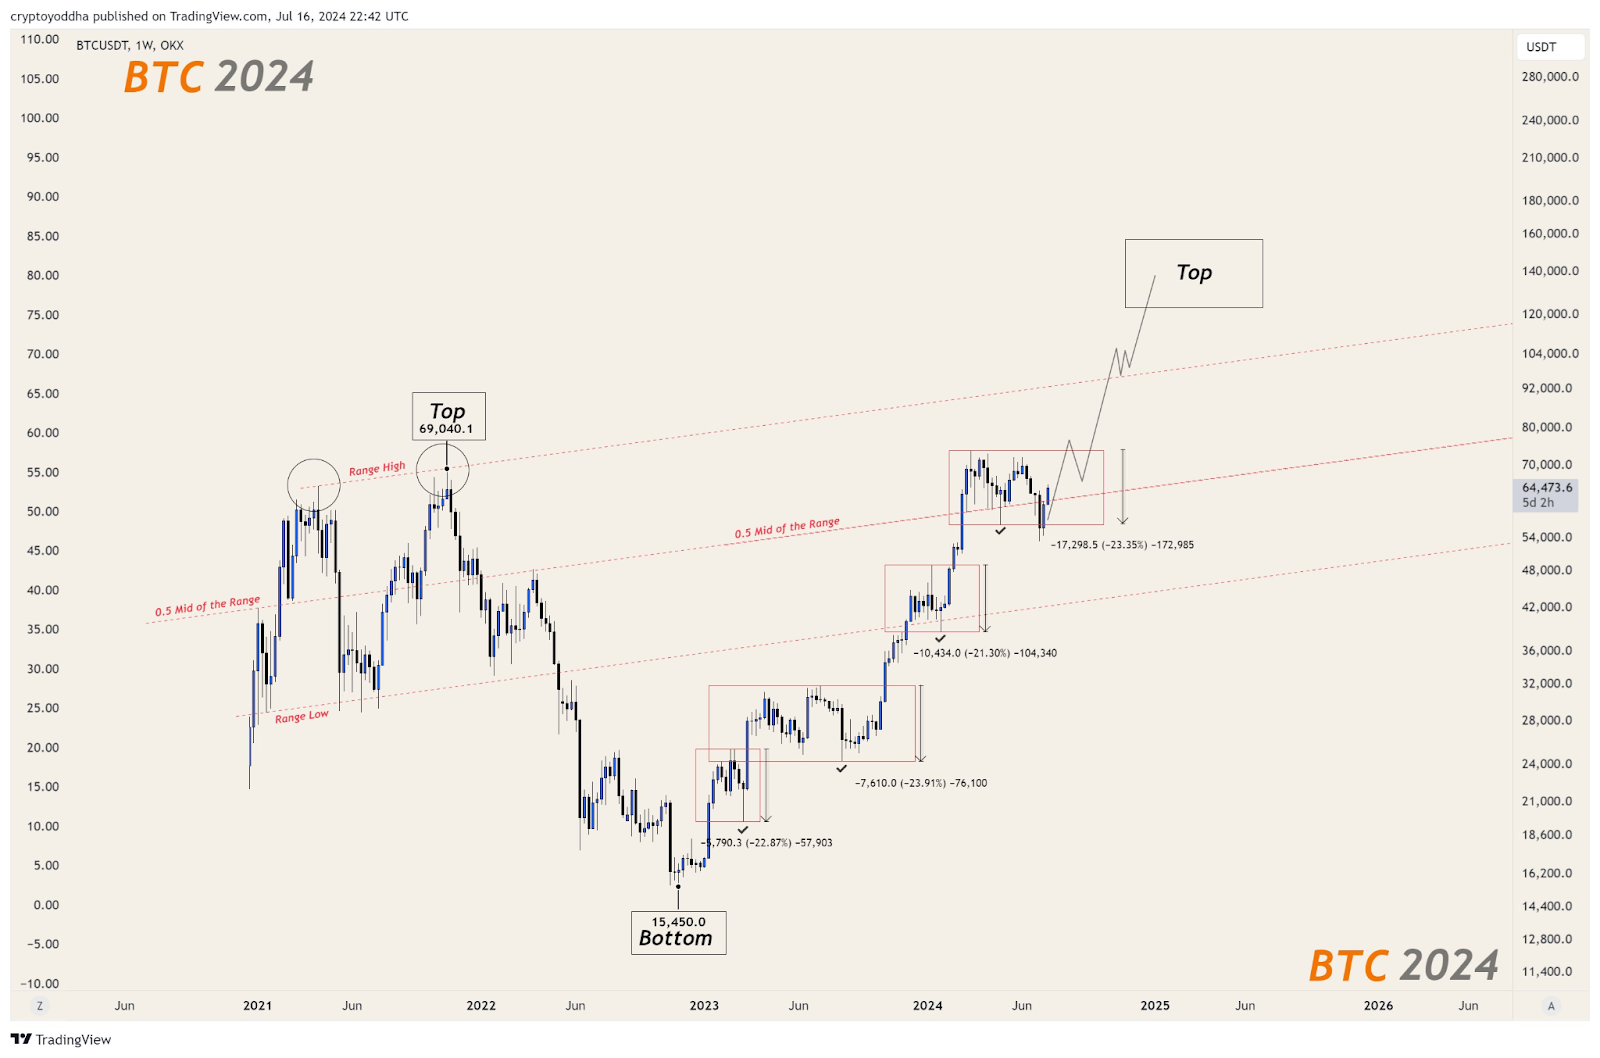
Intermediate support levels are marked at approximately $24,000, $18,600, and $15,450. These levels correspond with previous bottoms and correction phases. Similarly, intermediate resistance levels are noted at about $48,000 and $54,000, based on historical price actions and corrections.
The overall trend from the bottom of $15,450 indicates a robust uptrend. However, this trend includes several significant correction phases, typically ranging from -21% to -23%. If this uptrend continues, the price is projected to break the previous top of $69,040 and potentially reach new highs above $100,000.
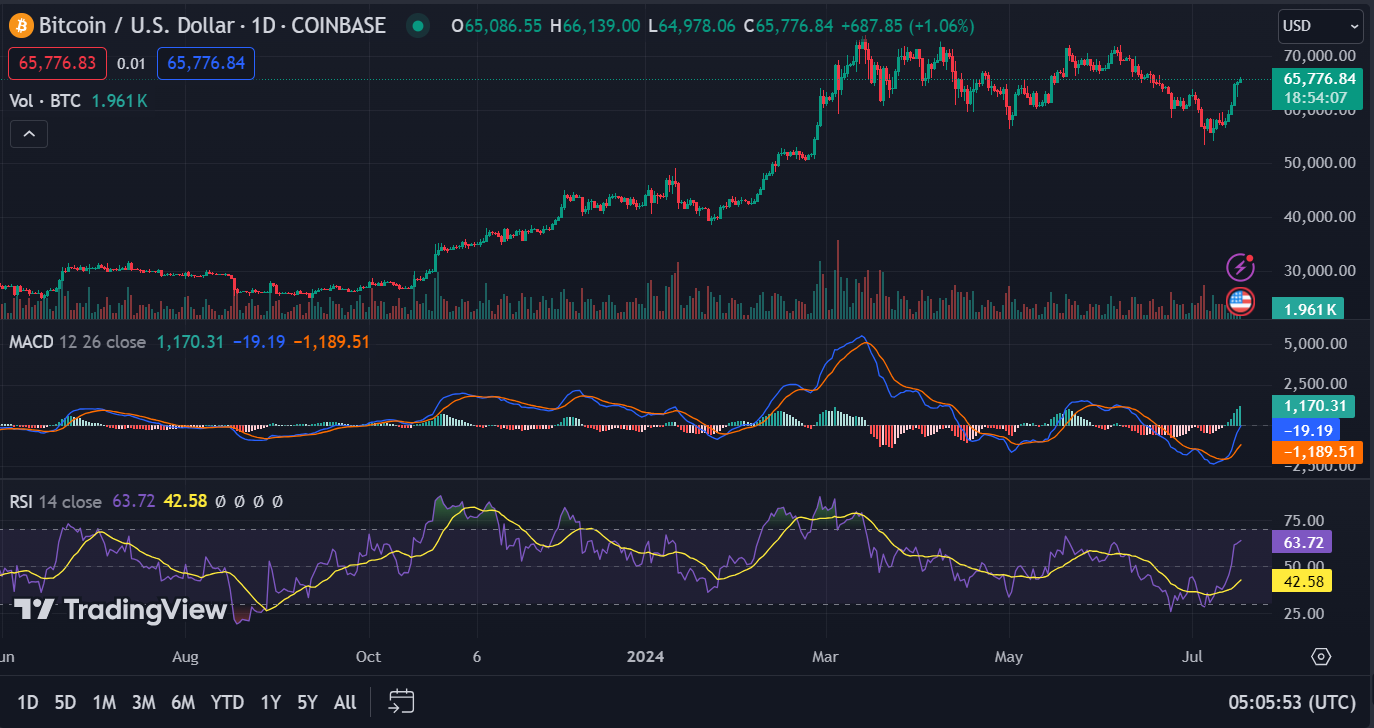
As of press time, the Bitcoin price stood at $65,770.18, with a 24-hour trading volume of $42,947,453,463. Bitcoin is up 1.88% in the last 24 hours. The 1-day RSI reads 63.95, indicating that Bitcoin is currently in a neutral position. Additionally, the 1-day MACD trading above the signal line suggests a potential bullish trend in the short term.


