


- Long-term holders’ transition to a holding phase signals renewed confidence in Bitcoin’s future.
- BTC dominance faces resistance at 53.77%, suggesting potential market reversals.
- Despite short-term fluctuations, over 50% of Bitcoin remains inactive, reflecting strong holder conviction.
Bitcoin’s recent price action has been the subject of intense scrutiny, with market observers closely monitoring the behavior of long-term holders (LTHs) and the dynamics of BTC dominance. Amidst the volatility, a notable trend has emerged as LTHs have transitioned from a distribution phase to a holding phase, indicating a renewed confidence in Bitcoin’s future prospects.
During bullish phases, it’s common to observe LTHs offloading portions of their Bitcoin holdings as prices rise. However, the recent data suggests a departure from this pattern. As highlighted by CryptoQuant, an onchain analytic firm, the 1-year+ and 2-year+ cohorts have ceased selling, opting instead to retain their holdings amidst the current price recovery. This shift in holder behavior underscores a growing conviction in Bitcoin’s long-term value proposition.
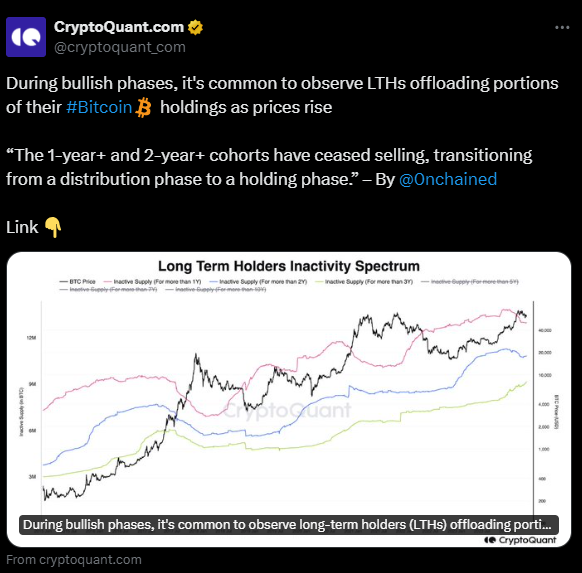
Despite fluctuations in short-term price movements, more than 50% of the total Bitcoin supply has remained inactive on-chain for over a year. This steadfast commitment among long-term holders reflects a deep-seated belief in the resilience of the digital asset, transcending market volatility.
The technical outlook for Bitcoin is currently at a critical juncture, with the price testing significant support levels. While the behavior of long-term holders signals a strong underlying bullish sentiment, key on-chain metrics must also be considered. A break below the daily Ichimoku cloud could potentially trigger a price retracement towards $64,000, necessitating vigilance from investors in the weeks ahead.
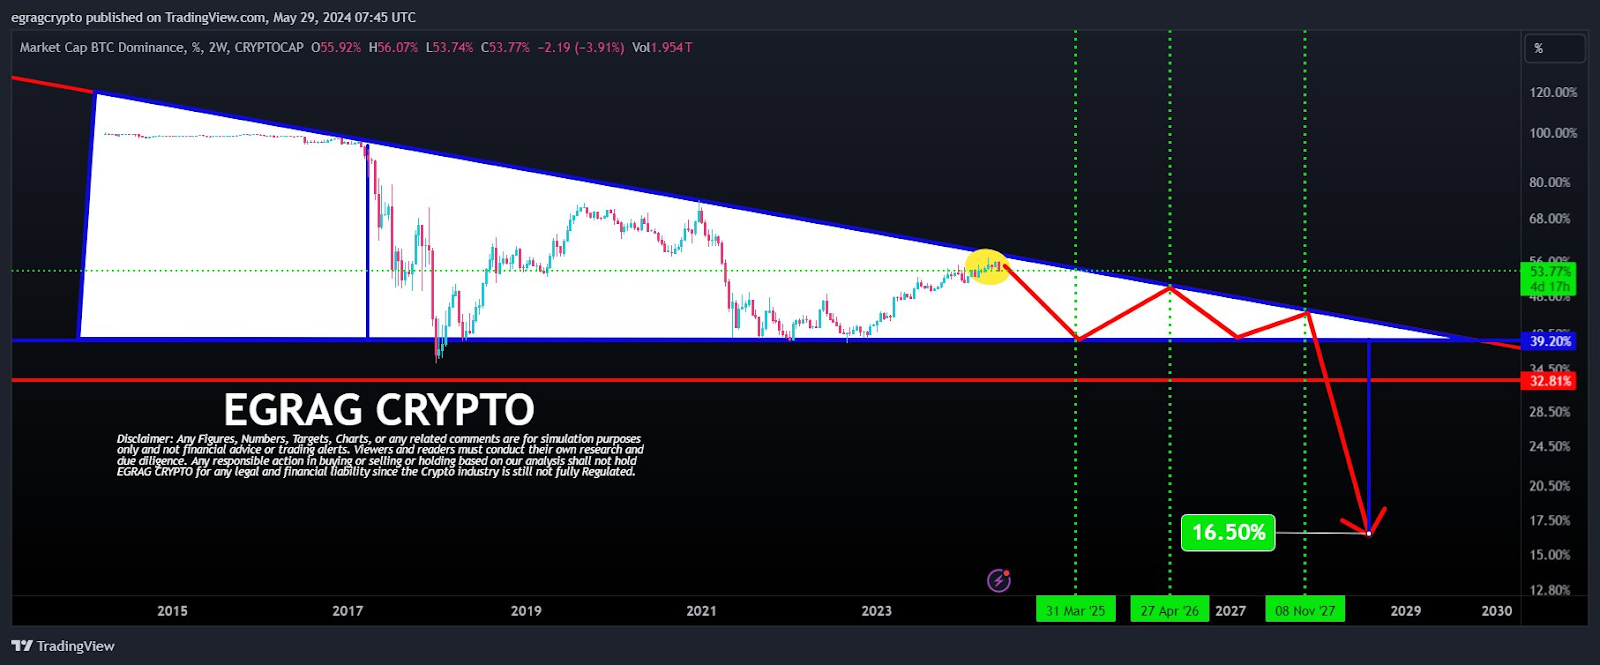
Turning to BTC dominance, the chart depicts a multi-year perspective, highlighting key support and resistance levels crucial for understanding market trends. BTC dominance faces significant resistance at 53.77% level, with historical data indicating frequent reversals. A secondary resistance level at 39.20% suggests potential oscillation in dominance levels in the coming months.
Key support at 32.81% serves as a floor for BTC dominance, historically attracting buying interest and maintaining market stability. However, the chart also reveals a descending triangle pattern, indicating a potential bearish outlook if dominance breaks below lower support levels.
As at press time, the live Bitcoin price stands at $67,909.95, with a 24-hour trading volume of $29,329,238,447, despite a marginal 0.21% decline in the last 24 hours


