


- Crypto analyst Patel highlights optimal Bitcoin short entry between $66,000 and $66,500 for traders.
- Technical analysis reveals significant ‘Break of Structure’ and ‘Order Block’ as critical market indicators.
- Patel’s charts suggest a pivotal role for the $60,000 ‘High POI Area’ in upcoming trends.
Bitcoin, a leading cryptocurrency, has been the subject of an insightful analysis by crypto expert Patel. Drawing from data on the X platform, it was evident that Bitcoin’s hourly price movements and highlighted essential technical markers for traders.
Patel outlined a strategic short entry point for Bitcoin, marked by a precise combination of an Order Block (OB) and a Fair Value Gap (FVG), established at $66,400. He predicted that following this entry point, Bitcoin would likely reach a new lower low (LL), with a stop loss advised above the OB.
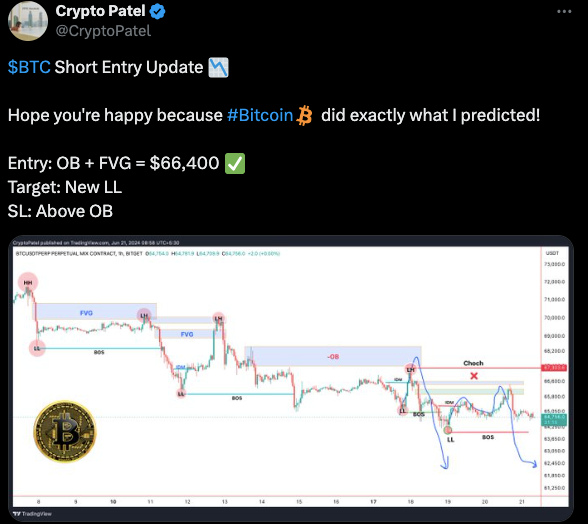
Patel’s analysis pinpointed significant trading signals such as ‘Higher Highs’ (HH) and ‘Lower Lows’ (LL), which are crucial for understanding Bitcoin’s momentum and possible directional changes. These indicators are vital for traders looking to capitalize on price movements.
A key aspect of Patel’s review was identifying a ‘Break of Structure’ (BOS), suggesting a major shift in market dynamics. This signal is often considered by traders when deciding whether to enter or exit positions.
Moreover, the analysis included detailed notes on ‘Fair Value Gaps’ (FVG) and an ‘Order Block’ (OB), which traders consider to determine potential resistance or support levels. These markers help predict where prices might find temporary stability or face a turnaround.
Bitcoin Whale’s $395M Buy Signals Market ConfidenceA particular focus was placed on an area labeled ‘Choch,’ highlighting a pivotal point on the price chart. This point is critical for those tracking Bitcoin’s short-term price trajectory.
In a recent X update, Patel shared a potential short setup for Bitcoin, noting that prices between $66,000 and $66,500 could be an optimal entry point for traders aiming for a new lower low. Conversely, closing any trading candle above $67,300 might suggest a shift from a bearish to a bullish trend.
He also highlighted a ‘High Point of Interest’ (POI) area of around $60,000, which could serve as another crucial juncture for market watchers. As per the data on Friday, Bitcoin has experienced a slight decline in 24 hours, with its price currently standing at $64,582, marking a 1.42% decrease. This movement is reflected in the day’s trading volume, which surged by 36.04%, amounting to $25.65 billion.
Despite this, Bitcoin maintains a strong market cap of $1.27 trillion. The intraday chart reveals a peak at approximately $66,451 before encountering resistance, leading to a downward trend settling near $64,500.
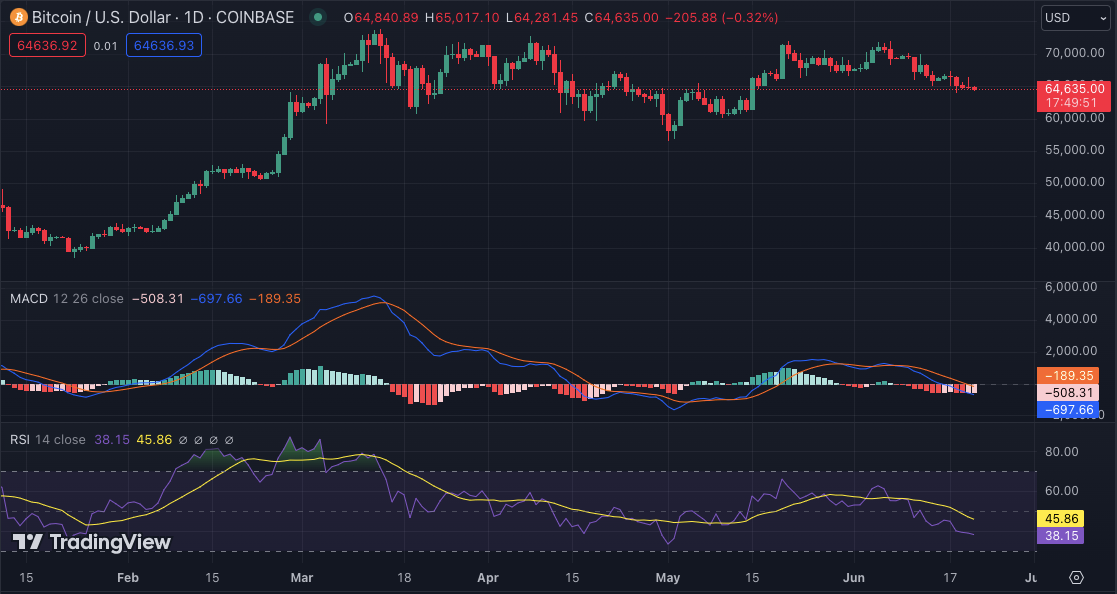
The technical indicators on the 24-hour chart reveal a subtle shift in Bitcoin’s momentum. The Moving Average Convergence Divergence (MACD) is currently exhibiting a downward trend, suggesting a decrease in buying pressure. Conversely, the Relative Strength Index (RSI) remains in a neutral zone, indicating neither overbought nor oversold conditions at a score of 38 levels.


