


- Bitcoin’s 50-day moving average consistently surpasses the 200-day, signaling bullish market sentiment.
- The recent dip in RSI below 40 suggests potential short-term bearish trends for Bitcoin.
- Bitcoin’s current price nears the Fibonacci 0.236 level, potentially strong support amid downtrends.
Bitcoin, a leading cryptocurrency, has displayed impressive resilience and growth, according to a recent analysis by Charting Guy X post. The analysis, from late 2023 to mid-2024, shows Bitcoin’s price is experiencing significant variations but maintaining an overall upward trajectory.
This period’s price chart features two key moving averages: the 50-day moving average in red and the 200-day moving average in green. The 50-day moving average consistently surpassing the 200-day moving average suggests positive long-term investor sentiment, indicating a bullish market.
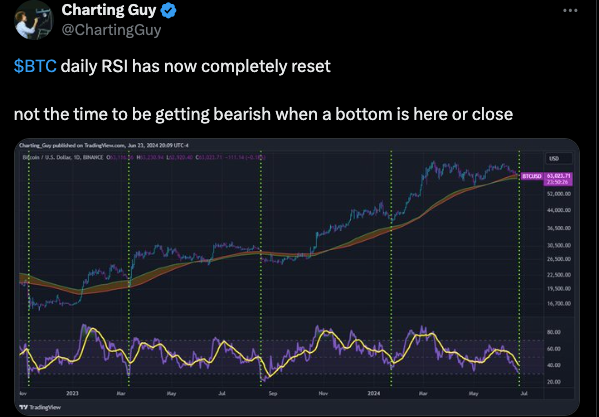
Source: X
Moreover, the Relative Strength Index (RSI), presented below the main price graph, shows fluctuations highlighting changing market pressures. The RSI recently dipped below 40, hinting at potential short-term bearish trends unless a rebound follows.
In another development by the notable crypto analyst Charting Guy on X post, Bitcoin’s price trends have shown a pattern of fluctuation within distinct Fibonacci retracement levels, indicating pivotal support and resistance points for traders. The chart illustrates Bitcoin’s trading trajectory over the past few months, marking key levels that have historically acted as barriers to the price movement.
Bitcoin’s $675 Million Transfer Sparks Market Buzz: What’s Next?Over the period observed, the price of Bitcoin initially saw an upsurge, reaching a high of nearly $73,835. This peak was followed by a gradual decline, aligning closely with the Fibonacci retracement levels.
The key Fibonacci levels for Bitcoin marked on the chart at 0.236, 0.382, 0.5, 0.618, 0.786, and 0.888 have seen significant interactions with the price, suggesting these points as potential zones of buying or selling pressure. At press time, the price was nearing the 0.236 level at around $60,183, which might act as strong support if the downtrend continues.
Over the past 24 hours, Bitcoin has experienced a notable decline in value, dropping 3.15% to a current price of $62,328. According to the latest data, Bitcoin’s market capitalization has also decreased by 3.15%, now at approximately $1.228 trillion.
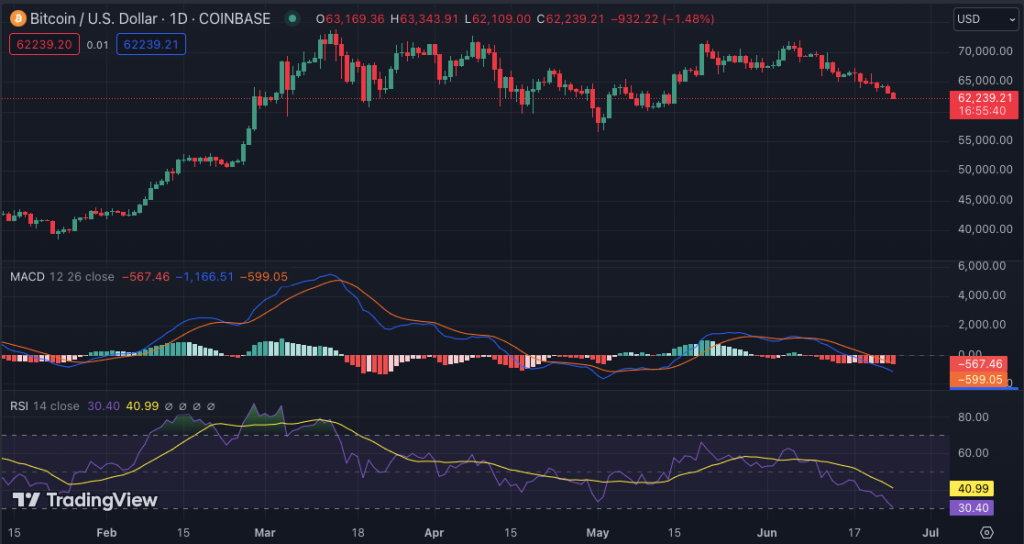
Source: TradingView
The daily technical indicators for Bitcoin reveal a downward shift in momentum. The Moving Average Convergence Divergence (MACD) continues to illustrate bearish sentiment, with the MACD line diverging further below the signal line, indicating a potential continuation of the downward trend.


