


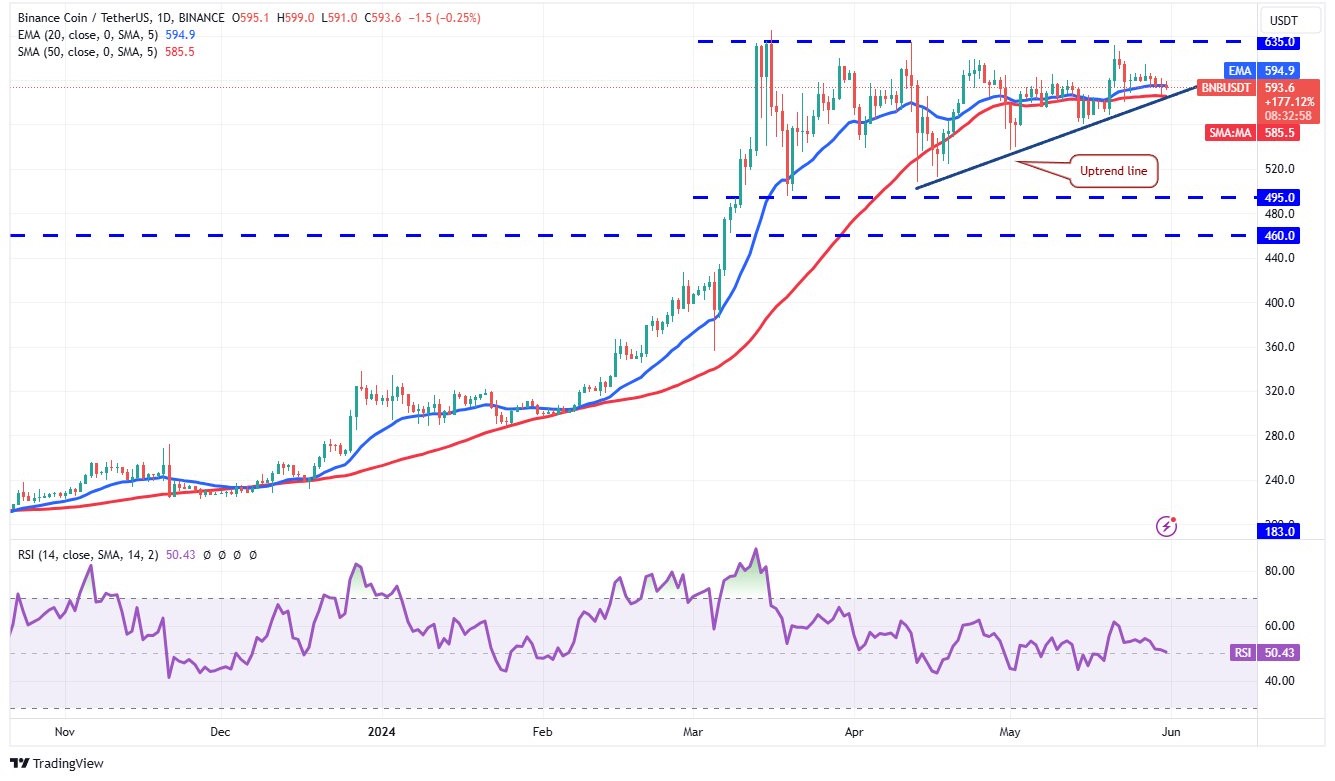
- BNB approaches a crucial uptrend line, with a potential rebound target at $635, forming an ascending triangle pattern.
- A fall below the uptrend line could invalidate the bullish trend, pushing BNB to $536 and further to $495.
- BNB’s market struggle is balanced, with key indicators showing neither buyers nor sellers having clear dominance.
Binance Coin (BNB) is currently facing a significant test as it approaches its uptrend line, a crucial support level. If the price rebounds with strength, bullish traders may push the BNB towards the overhead resistance at $635. Surpassing this level would complete an ascending triangle pattern with a potential target of $775.
On the other hand, if the price falls below the uptrend line, it would invalidate the bullish pattern. This could accelerate selling pressure, potentially driving the BNB down to $536 and the vital support to $495. The market’s next move hinges on how BNB interacts with this critical support level.
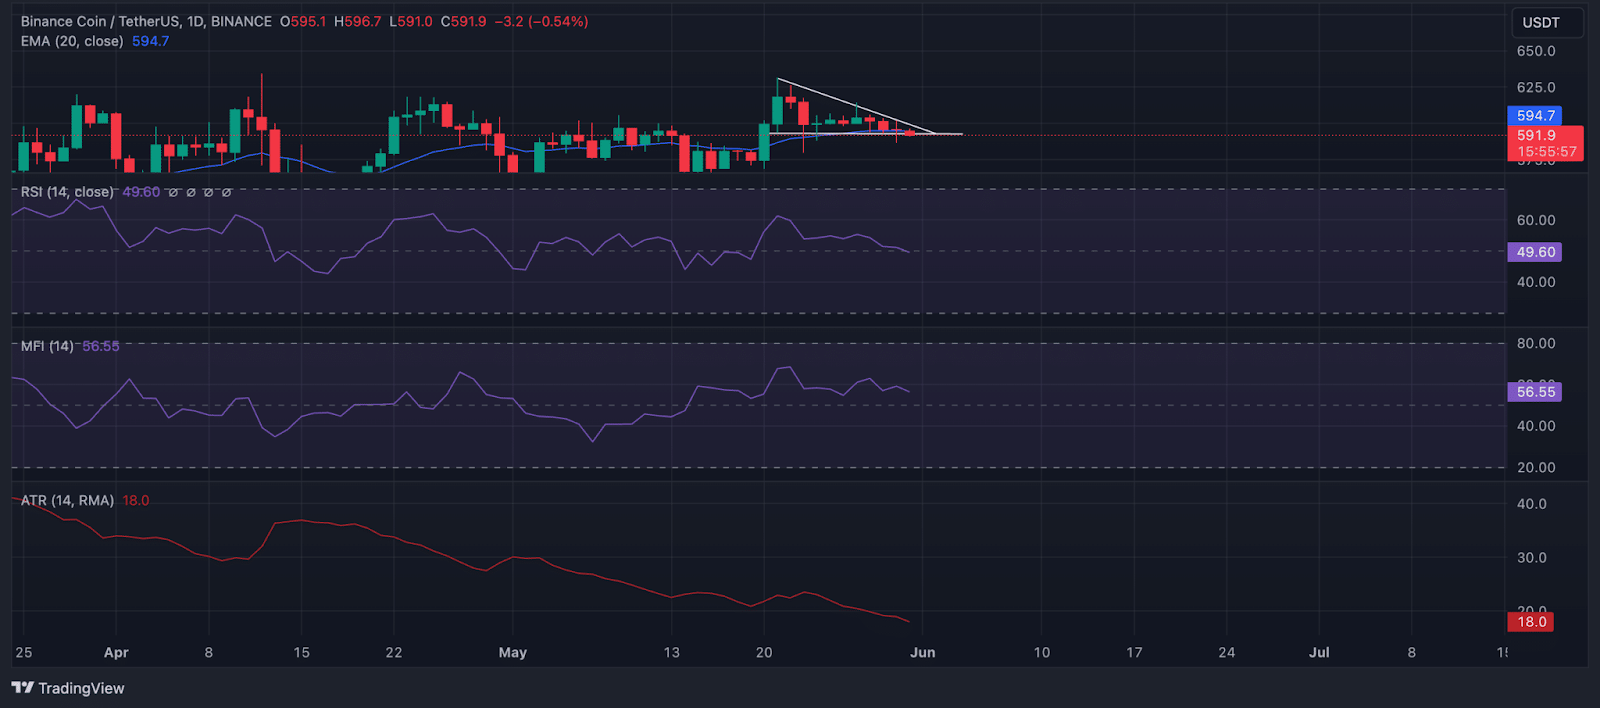
Since peaking at $612 on May 27, BNB has been in a downward trend, forming a descending triangle. As of press time, BNB is trading at $594.81, marking a 2.66% decline over the past three days. This trend has created uncertainty among traders, as BNB trades just below the lower boundary of the descending triangle, which acts as a support level.
For BNB to rally towards the upper line of the descending triangle, indicating resistance, there must be a significant increase in buying pressure. Current market readings from key momentum indicators show a balanced struggle between buyers and sellers. BNB’s Relative Strength Index (RSI) is at 49.50, while its Money Flow Index (MFI) is at 56.60, suggesting neither side has a clear dominance.
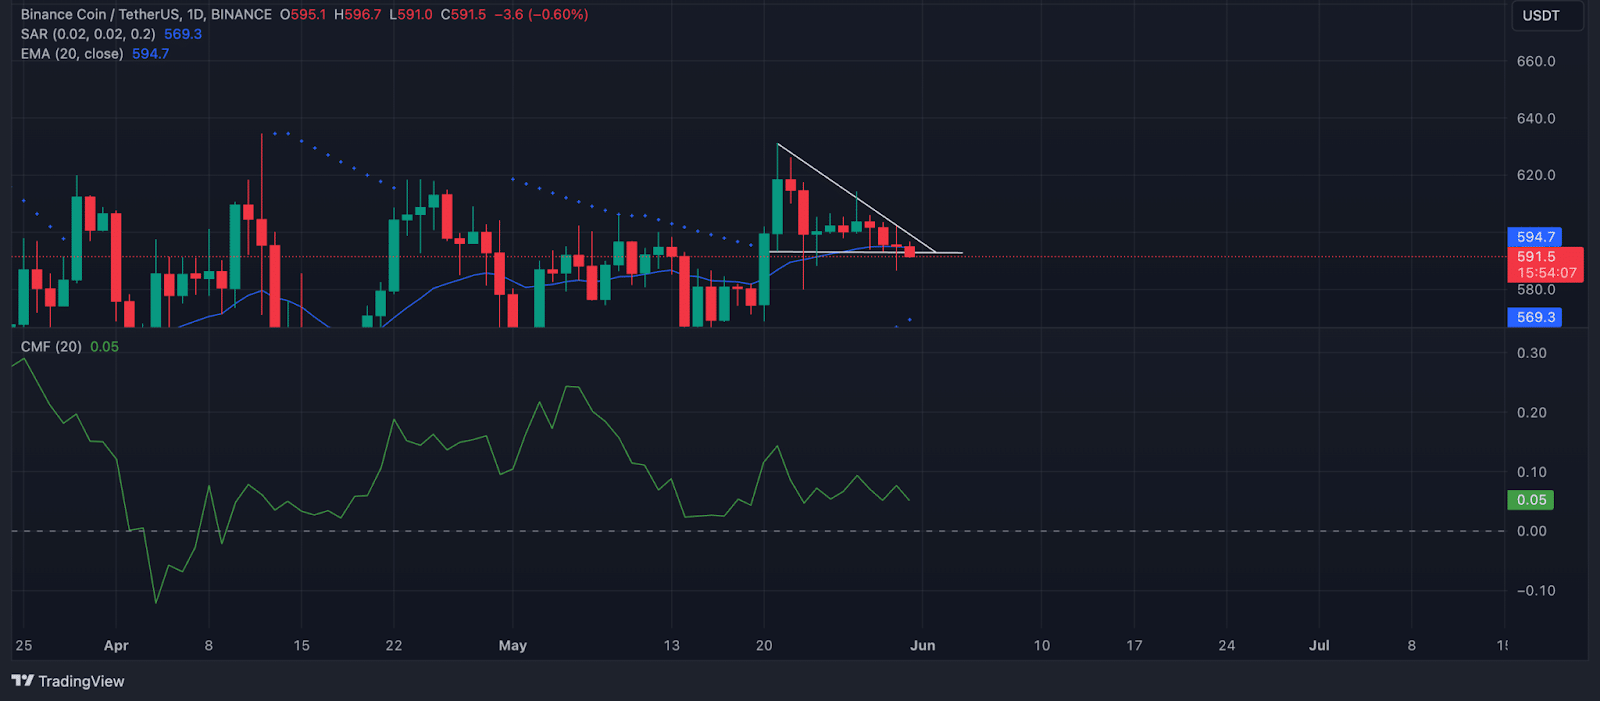
Additionally, the Average True Range (ATR), which measures market volatility, has decreased by 23% since May 23. This decline in ATR suggests that BNB’s price is becoming less volatile, indicating a phase of market consolidation.
Analyst Predicts BONK Retest of Range Highs, Signaling Future GainsBNB’s Chaikin Money Flow (CMF), which tracks money flow into and out of the market, is slightly above zero at 0.05. This positive CMF value indicates that there is still demand for BNB, although it is not overwhelming. Furthermore, the Parabolic SAR indicator shows dots beneath BNB’s current price, hinting at a potential short-term upward movement.
Despite recent declines, BNB is trading slightly above its 20-day Exponential Moving Average (EMA). This indicates that its current price is marginally higher than its average price over the past 20 days, a minor bullish signal.
The immediate future of BNB depends on its interaction with the uptrend line. Holding this support could lead to a significant upward move, while a breach might result in further declines. Traders are closely monitoring these critical levels to make informed decisions.


