


- BNB’s key resistance at $530 and support at $450 are pivotal for determining its next price direction.
- The RSI suggests BNB nearing oversold conditions, while MACD indicates short-term bearish momentum.
- A break above $530 could retest $680 resistance, but failure might lead to retesting $450 support.
Binance Coin (BNB) is currently navigating critical support and resistance levels against the US Dollar (USD), according to analysis by Crypto Tony, a top analyst. At press time, BNB trades at $523.45, experiencing a 1.41% increase over the last 24 hours. This analysis aims to provide an insightful overview of BNB’s potential future price movements based on recent trends and technical indicators.
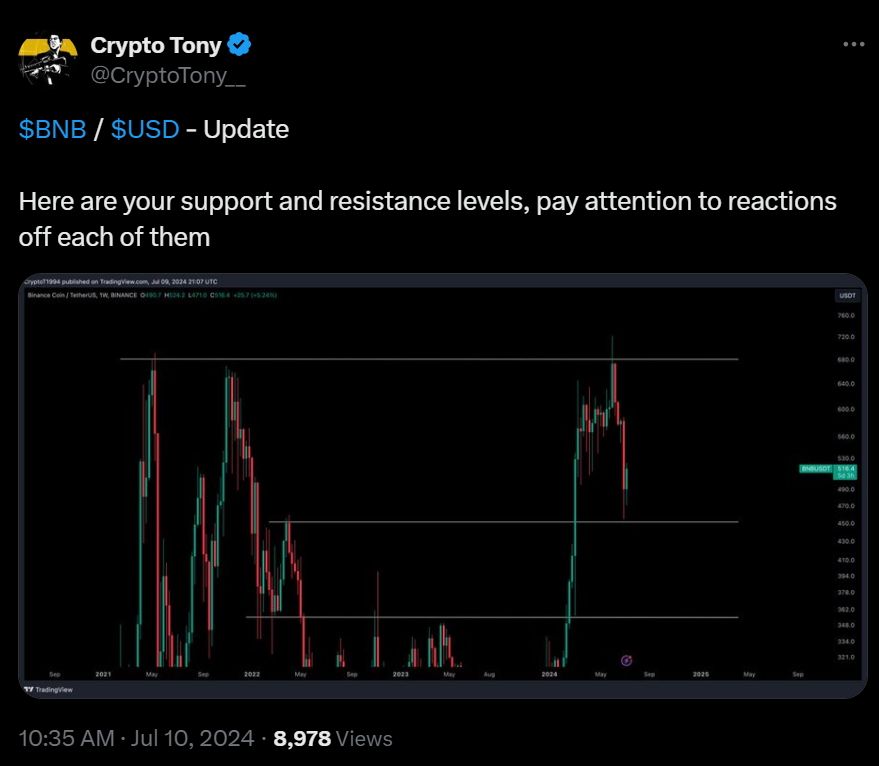
The key support and resistance levels for BNB reveal crucial points in its price journey. Firstly, the $450 support level has shown strong buying interest multiple times. Buyers have historically stepped in at this price. Another significant support level is at $350, which has previously held firm against price declines.
On the resistance side, $680 is a formidable level. This price point has been tested several times and has seen multiple rejections. Sellers have consistently defended this area. Another important resistance level is at $530, where the price has recently struggled to break through.
The trend analysis of BNB shows a significant upward movement beginning in early 2024. The price reached a peak near $680 before experiencing a pullback. Presently, the price is testing the resistance around $530. A successful break above this level could lead to a retest of the $680 resistance.
However, if BNB fails to break the $530 resistance, it may revisit the $450 support level. The overall trend remains bullish, characterized by higher highs and higher lows since late 2023. Despite this, the recent pullback from $680 suggests a potential correction or consolidation phase.
A break above $530 could see BNB retesting $680, and a successful break above $680 would signal further upside potential. Additionally, the continued formation of higher highs and higher lows would indicate sustained bullish momentum.
Cryptocurrency Market Analysis: Bullish Trends Amidst Altcoin SurgeConversely, in a bearish scenario, a rejection at $530 could lead to a retest of the $450 support level. A break below this support could result in further declines toward the $350 support area.
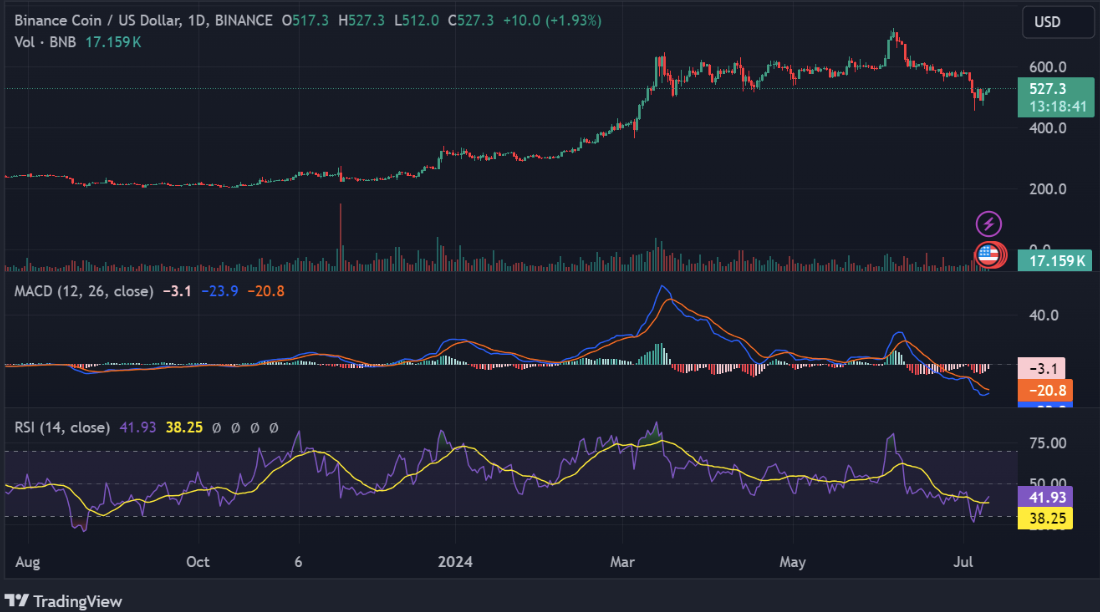
The Relative Strength Index (RSI) for BNB reads 41.26, suggesting that BNB may be approaching oversold conditions. Moreover, the Moving Average Convergence Divergence (MACD) is trading below the signal line. This indicates strong bearish momentum for BNB in the short term.


