
- BNB’s ascending triangle pattern suggests a bullish breakout above $640 USDT.
- BNB is anticipated to rise to $760 USDT with a confirmed breakout.
- Strong support and resistance levels define BNB’s path.
Binance Coin (BNB) has shown promising patterns in its recent price movements, drawing attention from traders and analysts alike. A significant chart pattern, the ascending triangle, suggests potential bullish momentum for BNB. As of Saturday, the price action is around $583, and recent market behavior indicates a critical juncture for the cryptocurrency.
The ascending triangle pattern, characterized by a horizontal resistance line and an ascending support line, is typically a bullish signal. In the case of BNB, the resistance is around $640 USDT, while the ascending support line has been tested multiple times, confirming its strength. This pattern often indicates piling of buying pressure, which might result in a breakout above the resistance level.
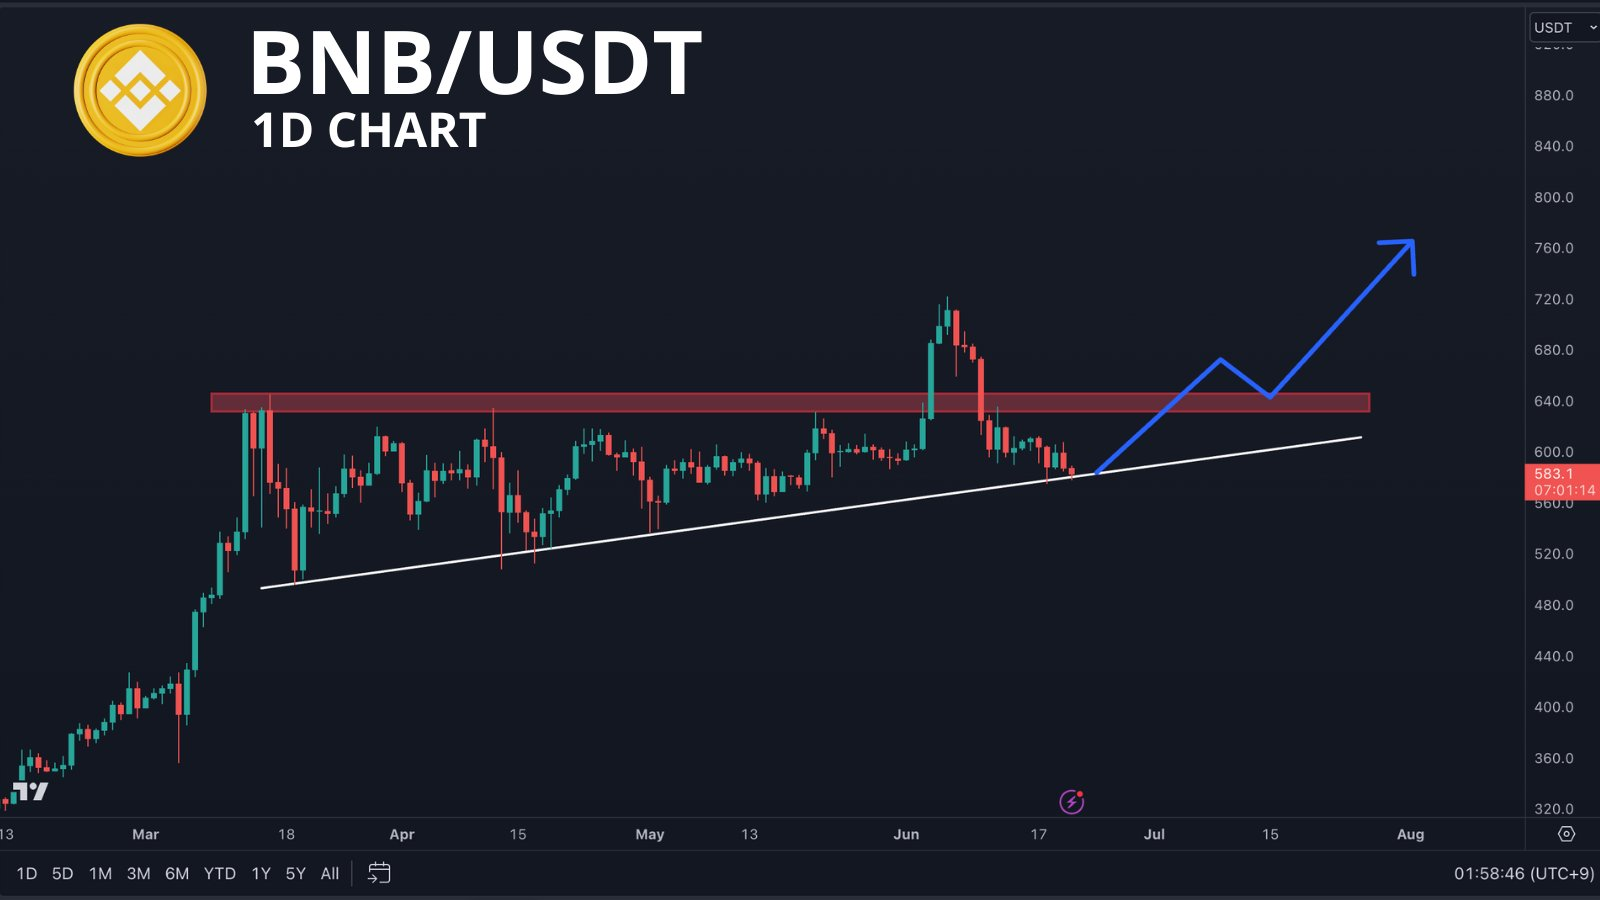
Lately, BNB experienced a fake breakout above the resistance line, quickly retracing back below it. This fake breakout has not discouraged traders, as the ascending trendline has supported the price. The current position of BNB, resting above the support line at around $583 USDT, indicates that another breakout attempt could be imminent.
CryptoJack, a popular cryptocurrency analyst, highlighted this scenario in a tweet. His analysis aligns with the chart patterns, indicating a potential buying opportunity if the price breaks above the resistance line.
Binance Coin (BNB) Shows Bullish Signs Despite Recent PullbackFor traders, the key strategy involves waiting for a confirmed breakout above the $640 USDT resistance level. A breakout should be followed by strong trading volume and positive price action to validate it.
In the case of a breakout, BNB could rally towards the next significant resistance level, projected at around $760 USDT. This potential movement is based on historical price behavior and the established pattern.
BNB is currently at a pivotal point, with an ascending triangle pattern suggesting a bullish breakout. At press time, it was trading at $586.63 with a 24-hour trading volume of $1,638,337,817.