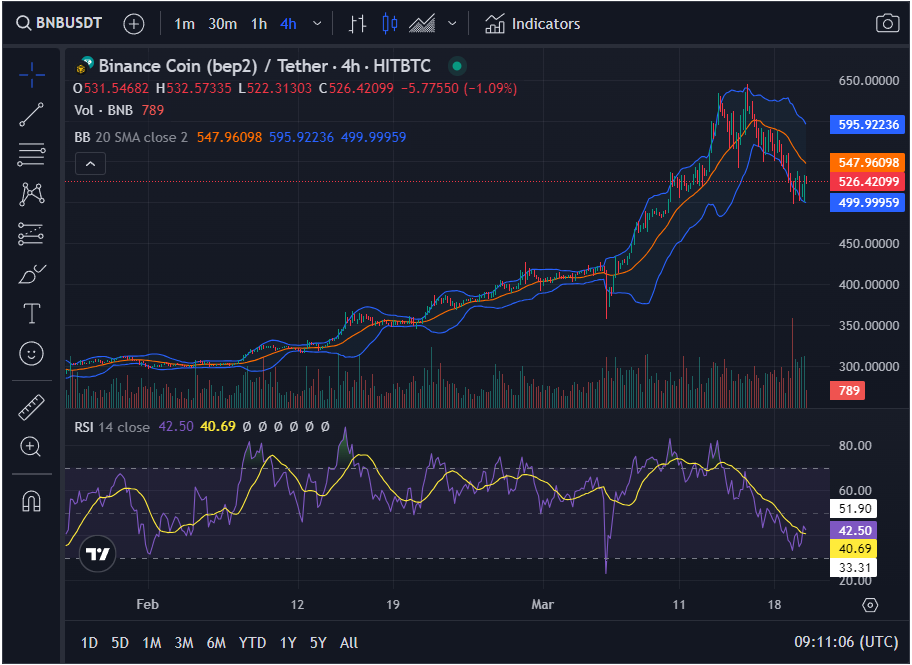
- Binance Coin (BNB) shows tentative signs of recovery, trading around $506 and hovering near the 100 SMA after a sharp drop.
- Analysts are closely watching BNB for a potential surge past the $550 mark, a move that could indicate a robust recovery toward the $580 resistance.
- BNB’s market value experienced a 6.11% decline over the past week, yet it stands out by performing better than the overall crypto market’s larger slump.
Binance Coin (BNB) presents an intriguing case study as it tests crucial support zones in its recent market performance. After a noteworthy decline from its peak, BNB demonstrates early signs of recovery, making this a pivotal moment for the cryptocurrency. Currently, the BNB/USD pair is closely monitored for its interaction with key market indicators, particularly as it trades near the 100 simple moving average (SMA). The ability of BNB to maintain stability above this level is crucial for signaling a potential upward trend.
Following a descent from its high near $645, BNB experienced a correction phase, pulling its value close to the $500 mark. Here, it displayed early recovery signs, trading around $506. This proximity to the SMA was earlier viewed as a positive indicator. Consequently, a significant resistance at the $520 mark has been broken in the 4-hour timeframe. Stability above this mark may prime BNB for an upward trajectory.

Source: Trading view on CG
Market analysts speculate on BNB’s ability to surpass the $550 resistance level. Achieving this would not only mark a strong performance in comparison to leading cryptocurrencies like Bitcoin and Ethereum but could also pave the way for BNB to approach the $580 resistance level. This step is seen as critical for initiating a more substantial rally, possibly reapproaching the $645 level.
At press time, BNB stands at $526.05, with a 24-hour trading volume of approximately $4.78 billion. This figure represents a 2.32% increase in the last 24 hours but a 6.11% decline over the past week. With a circulating supply of 150 million BNB, its market cap is valued at over $81 billion. Notably, BNB’s performance outstrips the general cryptocurrency market downturn of 13.60% but lags behind similar cryptocurrencies in FTX Holdings, which have seen an 11.40% uptick.
The BNB price trend shows an initial uptrend, followed by a recent reversal to a downtrend, evidenced by lower highs and lows. The chart’s 20-period SMA and Bollinger Bands indicate bearish momentum, with the price hovering near the lower band. A significant volume spike during the recent price drop suggests a strong bearish sentiment. The RSI at 41.74 points to neither an oversold nor overbought condition but indicates increasing bearish momentum. Key resistance is now at $547.81, with potential support around $499.56.


