


- Bonk (BONK) dropped 24% in 48 hours amid high trading volume, showing signs of consolidation.
- RSI at 42.88 indicates bearish momentum, nearing oversold conditions and potential for further consolidation.
- MACD crossover on the 4-hour chart suggests a possible shift from bearish to bullish momentum.
In the past 48 hours, Bonk (BONK) experienced a sharp short-term surge followed by a significant drop of over 24%. This volatile price movement has been driven by high trading volume as investors sought to capitalize on the recent dip.

Despite a recovery from a critical support level, BONK has declined again in the last 24 hours. Today, at press time Bonk’s price stands at $0.00001998, with a 24-hour trading volume of $348,257,937, reflecting a -5.01% decline in the last day and a -15.58% decline over the past week.
The daily chart presents several key indicators of Bonk’s current market performance. The Relative Strength Index (RSI) is currently at 42.88, which is below the 50 mark, indicating ongoing bearish momentum.
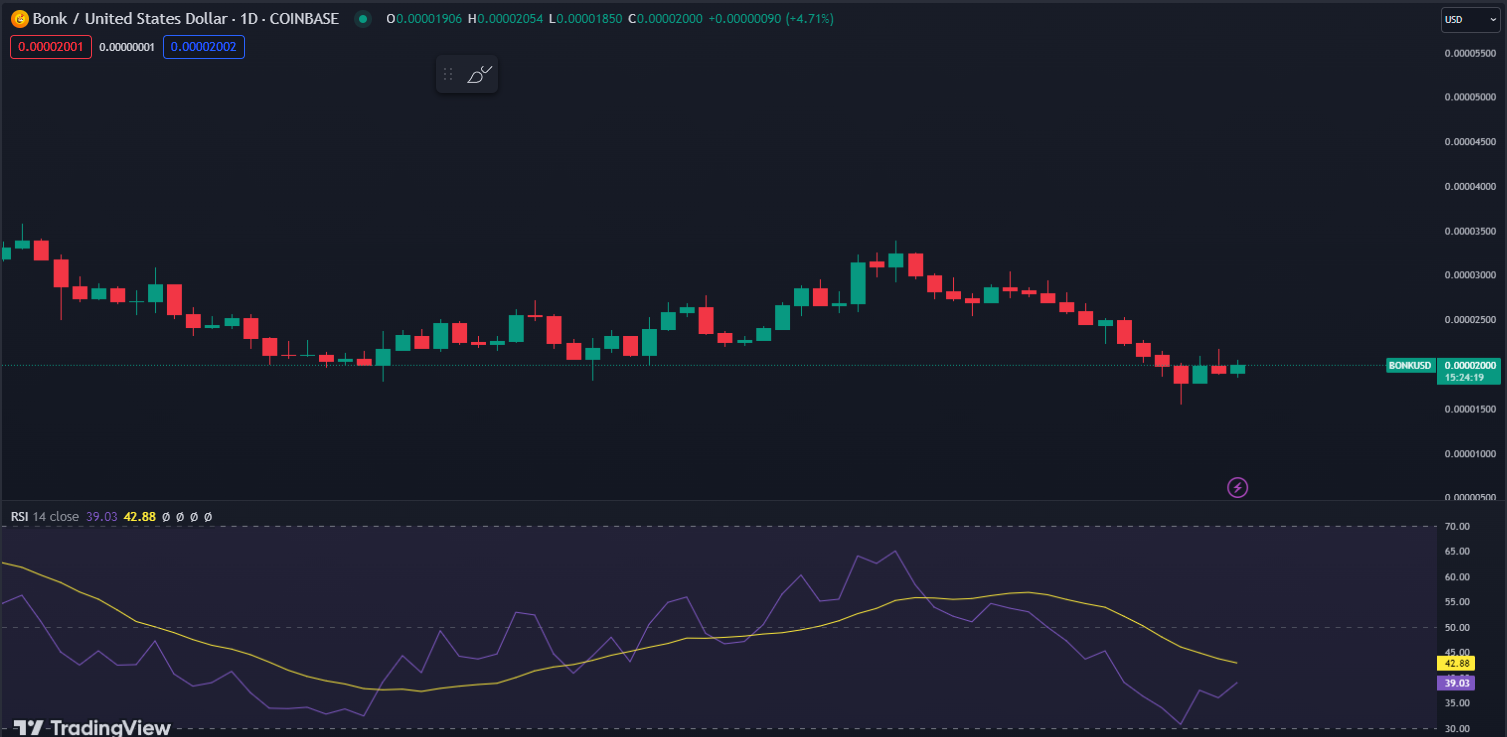
However, the RSI is approaching oversold conditions, suggesting that further downside or consolidation might occur before a potential reversal. Notably, the RSI moving average shows that the RSI is below its moving average, reinforcing the bearish trend.
The price action on the daily chart shows signs of consolidation around the support level. This is supported by the flattening RSI and the narrowing range of recent candles, indicating that the downtrend might be weakening. A break above the immediate resistance level of $0.00002165 with increased volume could signal a reversal. Conversely, a break below the recent low of $0.00001867 could indicate a continuation of the downtrend.
The 4-hour chart provides a closer look at Bonk’s recent price trends. The asset has been in a downtrend, marked by a series of lower highs and lower lows. Immediate support is around $0.00001700, as indicated by the lower Bollinger Band, while immediate resistance is at $0.00002202, near the upper Bollinger Band. Major resistance levels are further expected around $0.00002500 based on previous highs.

The Bollinger Bands on the 4-hour chart are relatively narrow, indicating low volatility. The price currently sits near the middle band, suggesting an equilibrium between buying and selling pressures. The MACD (Moving Average Convergence Divergence) indicator shows the MACD line crossing above the signal line, typically a bullish signal. Additionally, the histogram displays increasing green bars, signaling strengthening bullish momentum.
Critical Support Alert: Will $BONK Bounce or Break Down from Trendline Support?General observations from the 4-hour chart highlight that Bonk’s price is consolidating within the Bollinger Bands, indicating a period of low volatility and potential accumulation. The MACD crossover suggests a possible shift in momentum from bearish to bullish. Although the price is near the middle Bollinger Band, signaling a neutral stance, the MACD’s bullish indication could point to an upward movement in the near term.


