


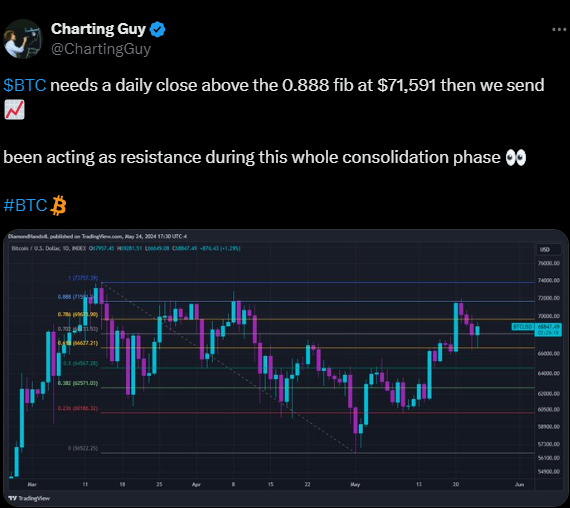
- Bitcoin’s price must close above $71,591 (0.888 Fibonacci) to maintain its upward trend and break recent resistance.
- Key supports at $66,627 and $64,567 are crucial for sustaining Bitcoin’s momentum amid recent upward trends.
- Trading volume hit $25.78B with Bitcoin up 2.11%, indicating robust market activity and potential bullish continuation.
The current Bitcoin cycle has seen a notable resurgence of long-term holders. In March, 3.7% of Bitcoin over ten years old was spent, coinciding with Bitcoin’s peak at $70,000. As highlighted by Julio Moreno, head of Research at CryptoQuant, this figure currently stands at 2.5%. This percentage reflects the 30-day cumulative annualized spending of Bitcoin held for over ten years.

As further noted by Charting Guy, a top analyst, Bitcoin’s price must close above the 0.888 Fibonacci level, at $71,591, to continue its upward trend. This level has consistently acted as resistance during the recent consolidation phase.
Analyzing the chart reveals an upward trend from early March to late May 2024. After peaking in mid-April, the price retraced and formed a significant trough in early May before rebounding. This pattern indicates potential for future gains, contingent on several critical support and resistance levels.
Key support levels include $66,627.21, corresponding to the 61.8% Fibonacci retracement level. This level has proven to be a significant support, often indicating a continuation of the trend.
Additionally, $64,567.28, the 0.5 Fibonacci level, acts as another crucial support point. This midpoint retracement often serves as a psychological barrier for traders. Further support is found at $62,571.03 (0.382 Fibonacci level) and $60,186.32 (0.236 Fibonacci level), which could offer strong support if the price drops significantly.
On the resistance side, $69,676.90 (0.786 Fibonacci level) is a significant barrier. The price has tested this level multiple times without breaking through. Close to recent highs, $71,594.82 (0.888 Fibonacci level) represents another substantial resistance point, just below Bitcoin’s all-time high.
The ultimate resistance lies at $73,757.39 (1 Fibonacci level), corresponding to the previous peak. Breaking this level would suggest a continuation of the bullish trend.
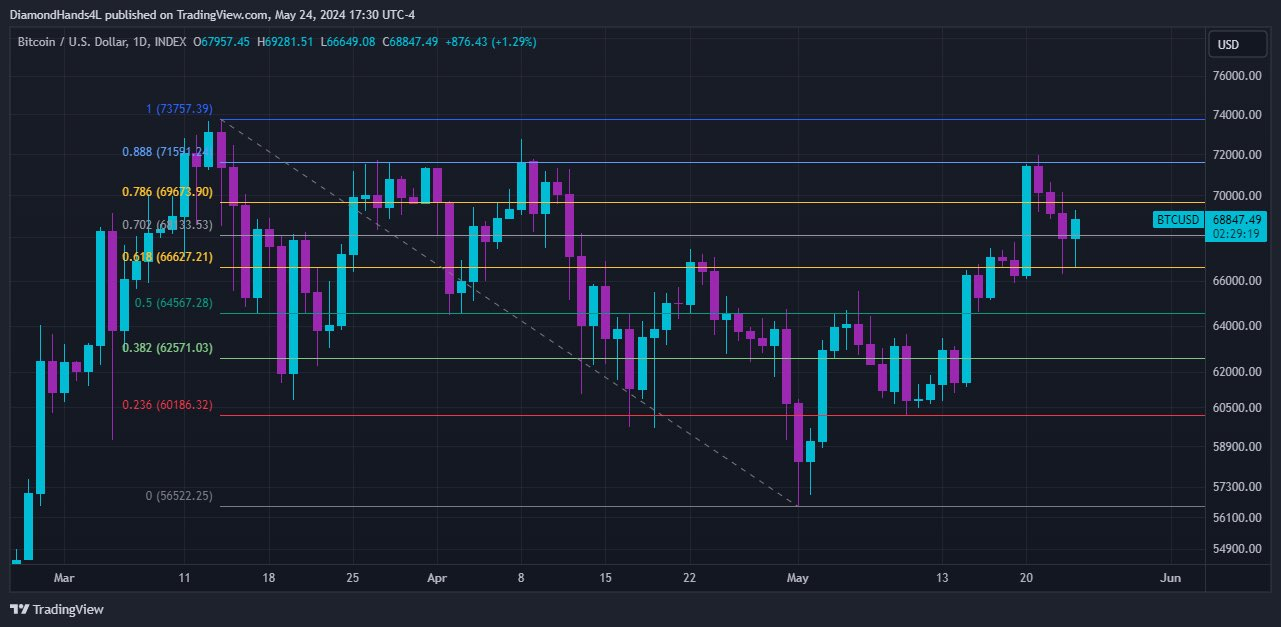
Currently, Bitcoin trades around $68,916 reflecting a slight pullback after testing resistance near $69,676.90. The recent upward momentum from early May indicates strong buying interest. If Bitcoin maintains above key supports like $66,627.21 and $64,567.28, it may re-test higher resistance levels.
However, a break below these support levels could signal a deeper correction towards $62,571.03 or even $60,186.32. In the past 24 hours, Bitcoin’s trading volume reached $25,781,999,128, and the price rose by 3%.


