


- Core faces crucial resistance at $1.9000 & psychological barrier at $2.0052, hindering upward movement.
- Recent crossover above 55-period SMA hints at potential shift from bearish to bullish momentum.
- Increased buying activity near key support levels signals strong interest from investors, potentially fueling upward movement.
Core (CORE) has emerged as a significant player, offering investors a promising opportunity within the BTC ecosystem as highlighted by Altcoin Sherpa, an analyst. With its current price hovering around $1.85 and a 24-hour trading volume of $142,962,732, Core showcases resilience amidst market fluctuations, albeit with a modest 0.21% uptick in the last 24 hours.
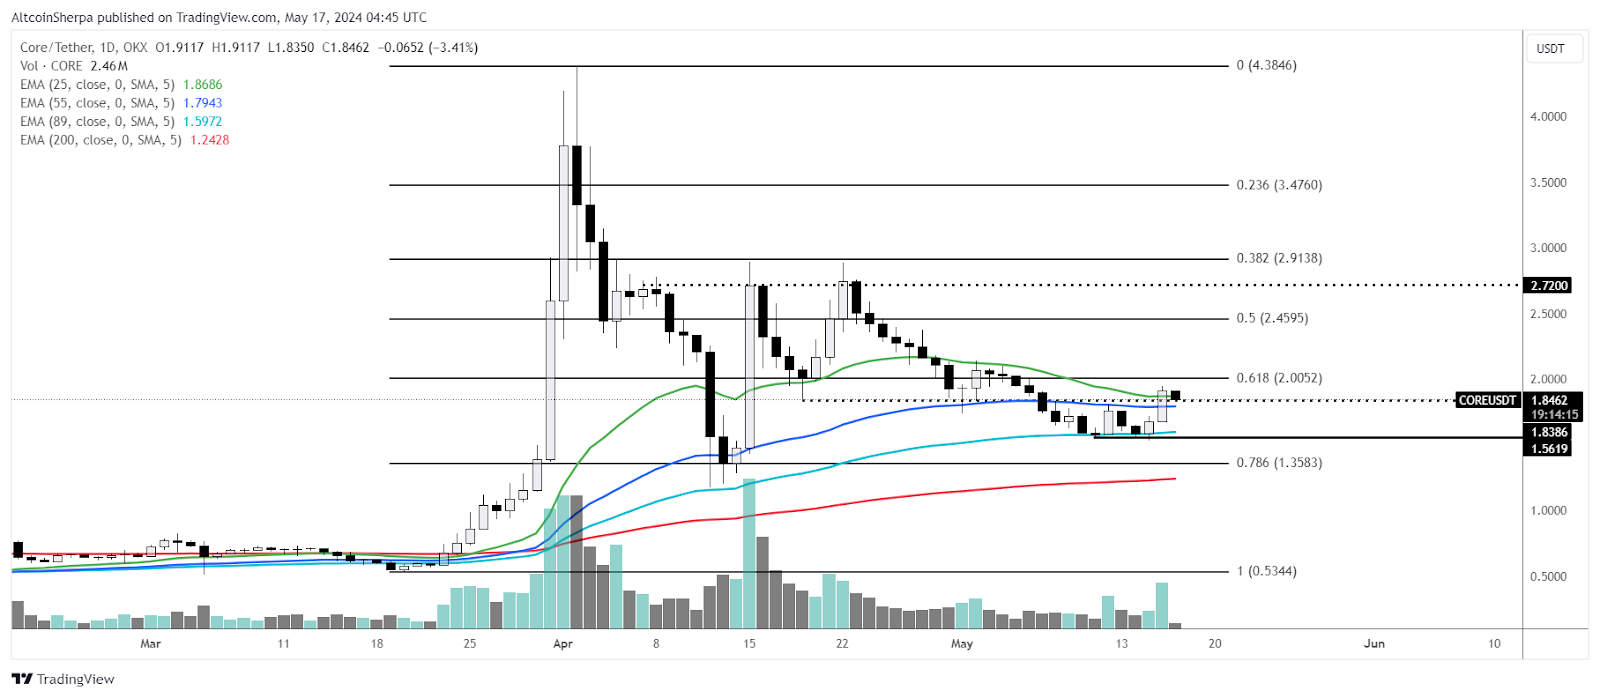
Key support levels are identified, with $1.5619 standing out as a crucial floor where buyers have consistently intervened, preventing further declines. Another notable support level resides at $1.7410, showcasing a zone of consolidation pivotal for sustaining upward momentum. Furthermore, $1.8386 emerges as a critical pivot point, coinciding with the 200-period SMA, amplifying its importance as a support level.
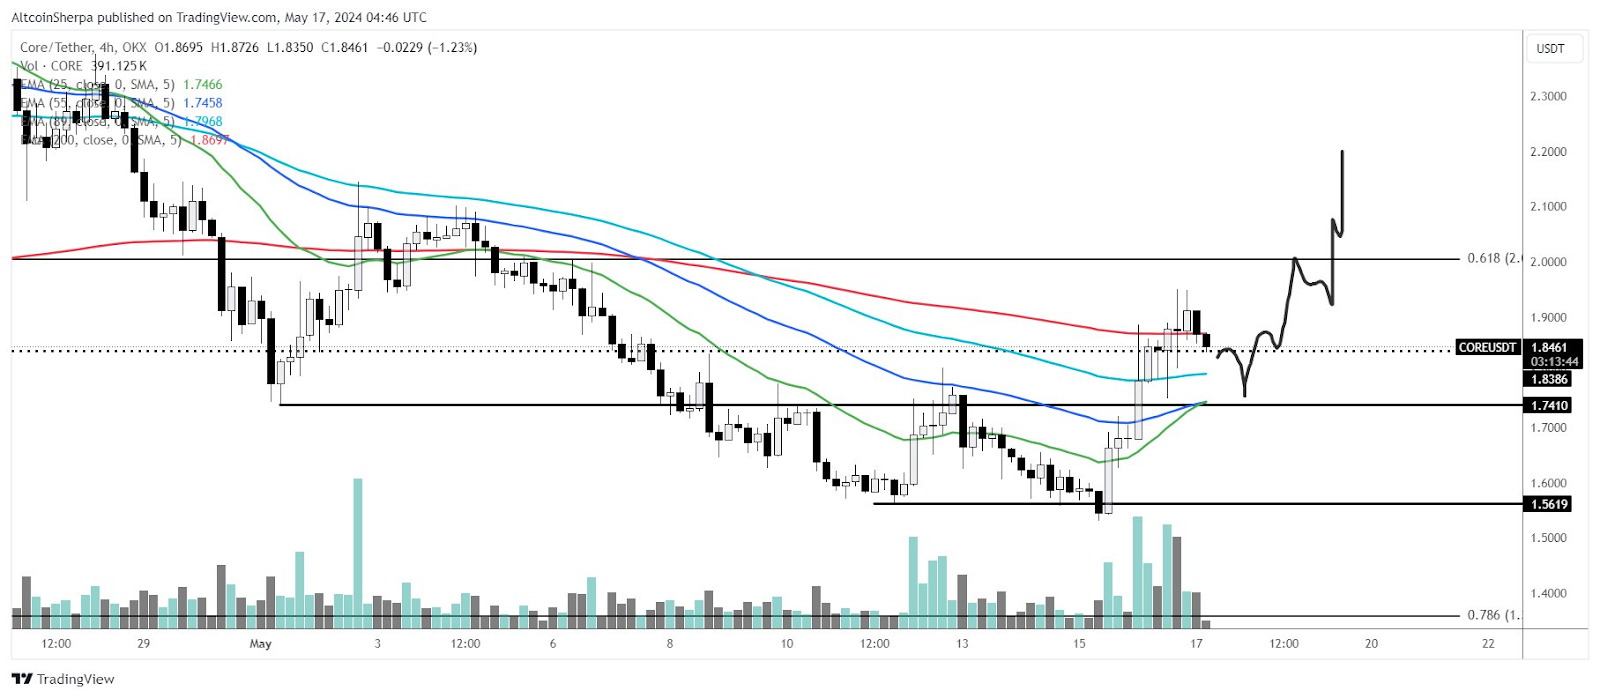
Resistance levels pose challenges for Core, notably at $1.9000, which is strengthened by the 100-period SMA. Moreover, psychological resistance is evident at $2.0052, aligning with the 0.618 Fibonacci retracement level, highlighting its role in hindering upward movement. Should the price breach these levels, $2.3000 emerges as the next significant resistance to overcome.
Moving averages offer insights into Core’s trajectory, with the recent crossover above the 55-period SMA signaling a potential shift from bearish to bullish momentum. However, challenges persist, particularly with the price encountering resistance at the 100-period SMA. Nevertheless, the recent cross above the 200-period SMA suggests a possible longer-term trend reversal, bolstering optimism among investors.
Volume analysis complements the technical outlook, with increased buying activity observed as the price nears key support levels. This surge in volume underscores strong interest from buyers, potentially catalyzing upward movement if the price maintains above current support zones.
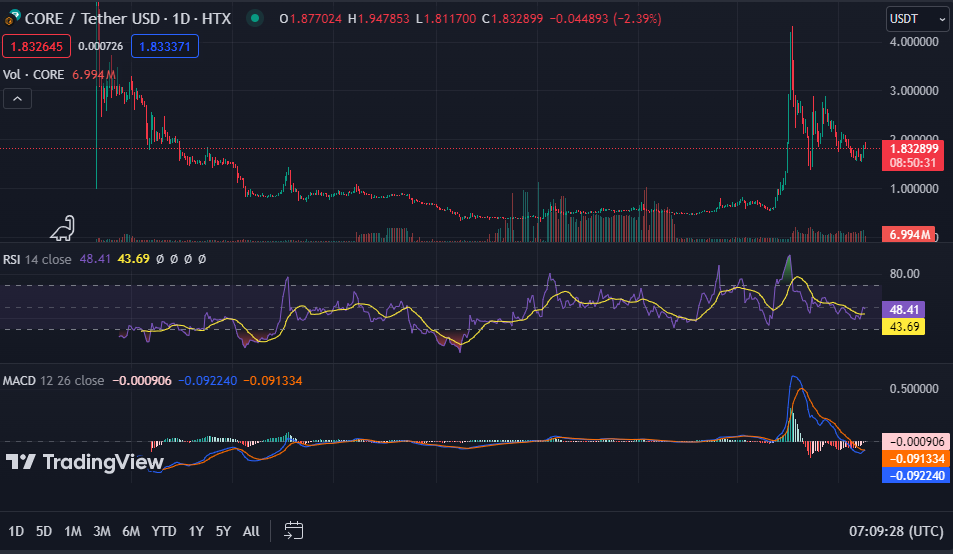
Technical indicators like the Relative Strength Index (RSI), Moving Average Convergence Divergence (MACD), and Average Directional Index (ADX) unveils nuanced signals regarding Core’s short-term trajectory. While the 1-day RSI indicates neutrality at 48.50, the MACD trading below the signal line suggests a hint of downward momentum in the near future. However, a potential MACD crossover above the signal line could signal a bullish reversal.


