


- Bitcoin’s pivotal $64,290 mark is crucial for a potential surge to $76,610 or a revisit to $51,970.
- Resistance at $64,290 and $76,610 presents challenges, underscoring the uphill battle for Bitcoin.
- Strategic buying around lower support bands complements selling near upper resistance bands for investors.
Bitcoin’s price trajectory has been a rollercoaster ride for investors, marked by peaks and valleys that reflect the unpredictable nature of the cryptocurrency market. Currently, all eyes are on the pivotal $64,290 mark, which, if reclaimed as support, could propel Bitcoin towards the lofty heights of $76,610. As highlighted by Ali Martinez, a top analyst, failure to surpass this threshold may see Bitcoin revisiting support levels around $51,970.

Analyzing the support and resistance levels provides valuable insights into Bitcoin’s price movements. The realized price support, standing firm at $28,921, signifies a fundamental backing based on the average price at which coins were last moved.
This suggests a steadfast belief in Bitcoin’s long-term value among market participants. Additionally, the -0.5 standard deviation support level, hovering around $39,650, serves as a psychological benchmark where buyers historically entered the market, perceiving Bitcoin as undervalued.

On the flip side, resistance levels pose formidable barriers to Bitcoin’s upward trajectory. The +0.5 standard deviation resistance, approximately at $64,290, represents a zone where the market views Bitcoin as overvalued, triggering selling pressure.
Meanwhile, the +1 Standard deviation resistance, towering around $76,610, signifies extreme resistance and an overbought condition, indicating a formidable sell zone. Notably, Bitcoin has yet to breach this level within the displayed timeframe, underscoring the challenge of reaching such lofty heights.
In the current landscape, strategic buying opportunities emerge around the lower support bands (-1 standard deviation and -0.5 standard diviation), assuming these levels hold firm. Conversely, selling points materialize as Bitcoin approaches the upper resistance bands.
These bands represent the +0.5 standard deviation and +1 standard deviation levels, particularly if the price struggles to break through these barriers. These insights equip investors with a tactical approach to navigating Bitcoin’s volatile price swings, capitalizing on optimal entry and exit points.
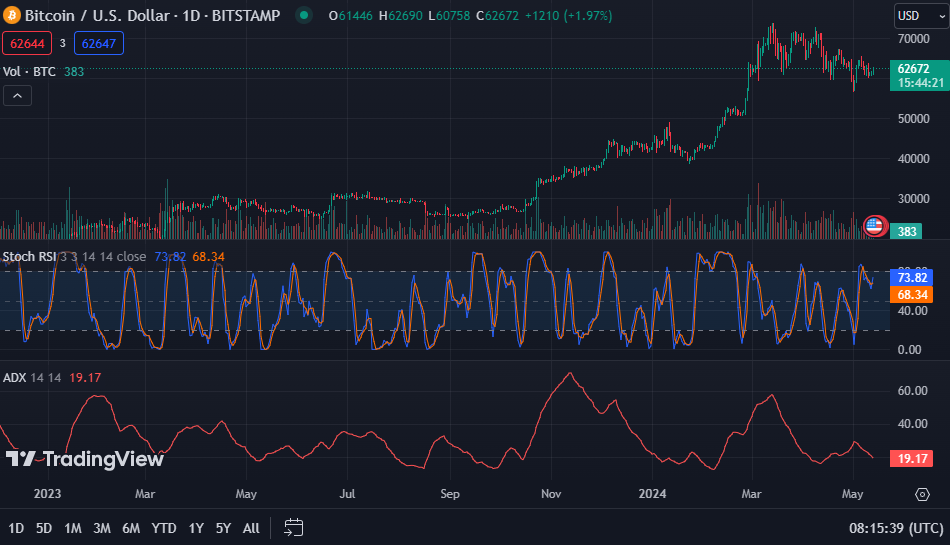
Trading at $61,596.65 at press time, Bitcoin’s current momentum indicators reinforces the bullish sentiment in the market. With the 1-Day Stochastic RSI trading above the signal line at 67.63, Bitcoin is in a bullish momentum phase, poised for potential price increases in the short term.
Furthermore, the 1-Day MACD trading above the signal line, reading -948, signals robust bullish momentum, indicating further price gains on the horizon. Although the 1-Day ADX reading of 19.32 suggests a relatively weak trend, the bullish signals from the Stochastic RSI and MACD could overshadow this, potentially driving continued price appreciation in the near future.


