
The last week ended with a Bitcoin’s bounce over $66K and most of the coins traded with green candles. Its recent rebound has caught many by surprise, silencing those who predicted a bear market earlier this month as highlighted by Santiment, a top analytic firm. As Bitcoin approaches the $70,000 mark again, key indicators suggest further bullish momentum in the near term.

As per analysis by Nebraskangooner, an analyst, over the past two weeks, Bitcoin has shown resilience, bouncing back significantly. As of press time, the price hovers around $67,617.22, with a 24-hour trading volume of $28,770,389,657. The digital currency has gained 0.76% in the last 24 hours. Observing the weekly timeframe, several critical levels and patterns hint at Bitcoin’s next potential moves.
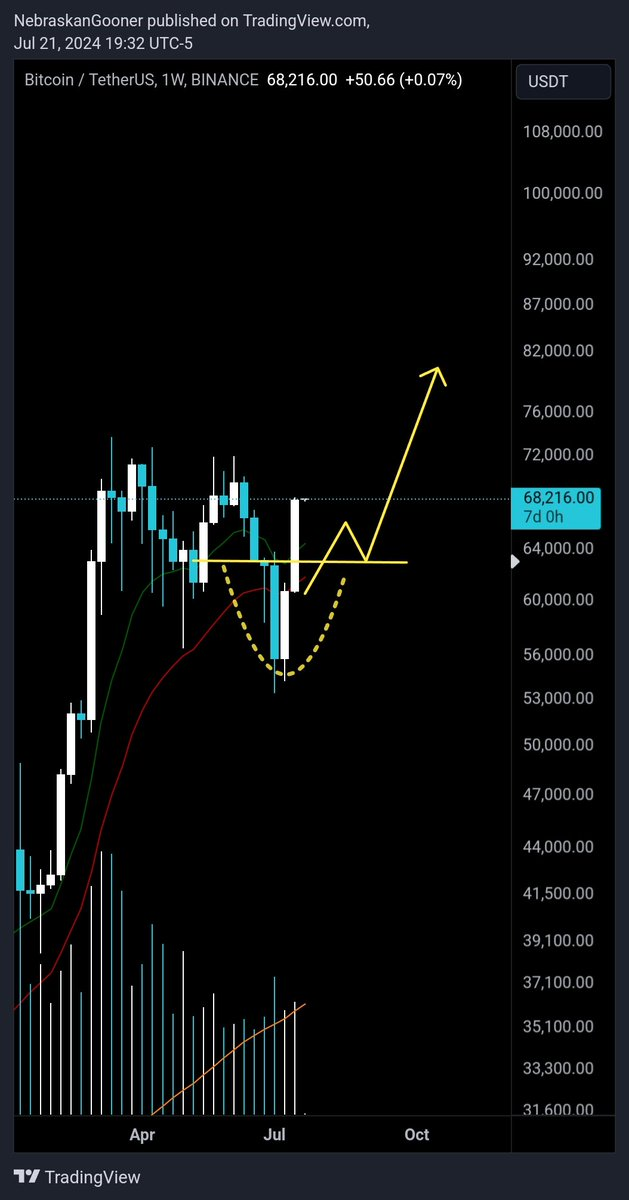
One significant support level stands approximately at $64,000. This horizontal yellow line on the chart has acted as a solid foundation, preventing prices from falling further. On the other hand, Bitcoin faces immediate resistance at around $76,000. Beyond this, there is a significant psychological barrier at the $100,000 mark.
Buterin Defends Ethereum’s Decentralization Amid Bitcoin’s Mining CentralizationA noteworthy pattern forming on the weekly chart is the potential cup and handle pattern. This formation, characterized by a rounded bottom (the cup) followed by a brief consolidation (the handle), typically signals a bullish continuation. The cup formation indicates that the price has found a bottom, while the handle suggests a period of consolidation before a breakout.
Moreover, the chart displays two key moving averages, likely the 50-week and 200-week. Bitcoin’s price is currently crossing above these moving averages, which is generally considered a bullish signal. This movement indicates a shift in momentum, suggesting that Bitcoin might continue its upward trajectory.
Projected price movement, as suggested by the yellow arrows on the chart, indicates a potential pullback to the $64,000 support level. This could form the handle of the cup and handle pattern. Following this consolidation, a breakout to higher levels is anticipated, with targets around $82,000 and possibly $100,000.

The 1-day RSI reads 65.75, indicating that the market may be slightly overbought in the short term. Moreover, the 1-day MACD trading above the signal line suggests that Bitcoin’s price may experience a slight correction or consolidation in the near future.