


- BlackRock’s IBIT and ETHA ETFs saw significant inflows, indicating strong investor trust in these products.
- Grayscale’s Bitcoin and Ethereum funds experienced contrasting flows, with notable withdrawals in Ethereum.
- Despite BlackRock’s gains, overall sentiment for Ethereum ETFs remained bearish due to substantial outflows.
On July 25, 2024, the U.S. Bitcoin (BTC) and Ethereum (ETH) exchange-traded funds (ETFs) exhibited diverging inflow patterns, according to data analyzed by SpotOnChain. The BTC ETFs saw positive inflows, indicating increased investment activity, while ETH ETFs faced overall negative inflows, suggesting a withdrawal trend among investors.
The total inflow for U.S. BTC ETFs stood at approximately $31.1 million USD. BlackRock’s IBIT ETF led the positive trend, recording an inflow of $70.7 million.
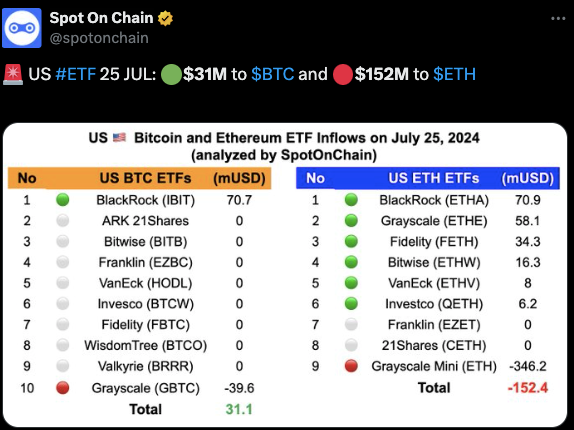
Despite this high influx at the top, other BTC ETFs reported zero movements. These include ARK 21Shares, Bitwise (BITB), Franklin (EZBC), VanEck (HODL), Invesco (BTCW), Fidelity (FBTC), WisdomTree (BTCO), and Valkyrie (BRRR). Grayscale’s GBTC ETF registered a substantial outflow of $39.6 million, contrasting sharply with BlackRock’s positive figures.
On the other hand, the U.S. ETH ETFs experienced a total outflow of $152.4 million, driven largely by a massive withdrawal of $346.2 million from the Grayscale Mini (ETH) ETF. While BlackRock’s ETHA ETF showed an inflow of $70.9 million and Grayscale’s ETHE ETF gained $58.1 million, these were not enough to counterbalance the large outflows from other funds.
Fidelity’s FETH and Bitwise’s ETHW also reported inflows of $34.3 million and $16.3 million, respectively. However, several funds, including VanEck (ETHV), Invesco (QETH), Franklin (EZET), and 21Shares (CETH), saw minimal to no inflow.
Solana’s Bullish Breakout: Key Support Levels to Watch as ETF Hype GrowsThis disparity in inflows between BTC and ETH ETFs highlights the differing investor sentiments and market dynamics affecting these two leading cryptocurrencies. While Bitcoin is gaining traction among institutional investors, Ethereum faces challenges, as indicated by the overall negative inflow numbers.
This illustrates the 30-day net inflow of Bitcoin Exchange-Traded Funds (ETFs). The data, presented in a combination of bar and line graphs, spans multiple trading days and shows significant fluctuations in daily net money movements into Bitcoin ETFs, represented in millions of USD.
Notably, there are days with negative inflows, such as -$226 million, showcasing considerable withdrawals or sales. The line graph, denoting the Bitcoin price in USD, shows a generally upward trend over the period, with some days reaching as high as $80,000.
As the trading days progress, the data exhibits high volatility in net inflows, with values swinging from as low as -$226 million to highs around $301 million.
The recent trends in Ethereum Exchange-Traded Funds (ETFs) indicate a mixed pattern in net inflows over a 5-day trading period. During the first day, the net inflow recorded a positive $107 million.
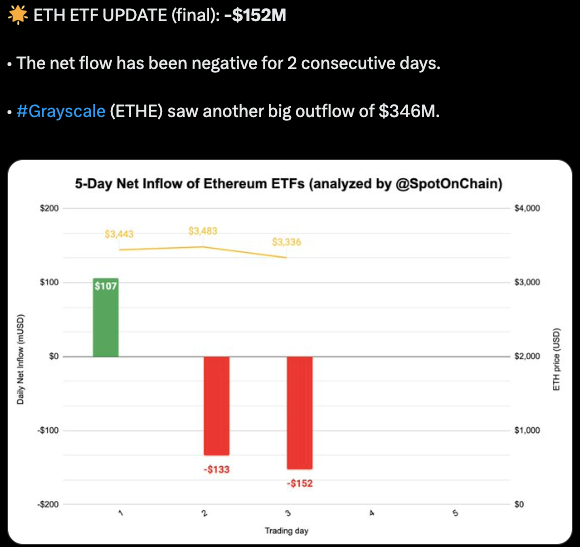
However, the subsequent days witnessed significant outflows, with a decrease of $133 million on day 2 and an even steeper drop of $152 million on day 3. These losses slightly recovered by the fifth day, although the specific inflow amount was not disclosed.


