


- The market closed bullish on Monday, with Bitcoin climbing above resistance.
- Bitcoin shows signs of a potential breakout, testing key resistance levels on the 4-hour chart.
- Analysts predict a price surge as Bitcoin breaks through a descending trendline, signaling an uptrend.
Bitcoin’s price action on the 4-hour chart suggests a potential bullish breakout. The market closed on a bullish note on Monday, with BTC trading above critical resistance levels, suggesting a continuation of the uptrend. This movement could indicate a significant price surge in the coming days.
In a recent analysis, Super฿ro, a trader, highlighted the formation of a descending broadening wedge on Bitcoin’s 4-hour chart. This pattern signals a potential reversal or continuation depending on the breakout direction. The upper boundary of this wedge, marked by a significant resistance level, has become the center of attention.
The chart shows Bitcoin testing the upper bounds of the wedge. If BTC successfully breaks above this level, it could trigger a bullish rally, potentially targeting the $65,000 range. However, the analyst also warns of the possibility that Bitcoin might fail to break out, leading to another dip toward the lower bounds of the wedge.
Another well-known crypto analyst, VeLLa Crypto, also weighed in on the current Bitcoin setup. VeLLa Crypto points out that Bitcoin is breaking through a descending trendline on the 4-hour chart against USDT.
The analyst suggests adjusting stop-losses higher for long positions on BTC as the price moves up. This approach locks in profits while allowing room for potential further gains. The analyst emphasizes the importance of the $60,000 level, where Bitcoin has faced consistent resistance. The immediate target area for this setup is around $64,800. This price range represents a key resistance level that, if surpassed, could lead to further gains.
Bitcoin Faces Bearish Pressure Amidst Major LiquidationsPrice Action and Technical Indicators
At press time, Bitcoin was trading at $61,175.30, reflecting a 4.76% increase in the last 24 hours. Trading volume has surged by 48.79% over the same period, reaching $28.76 billion, indicating strong interest in Bitcoin as it continues to climb.
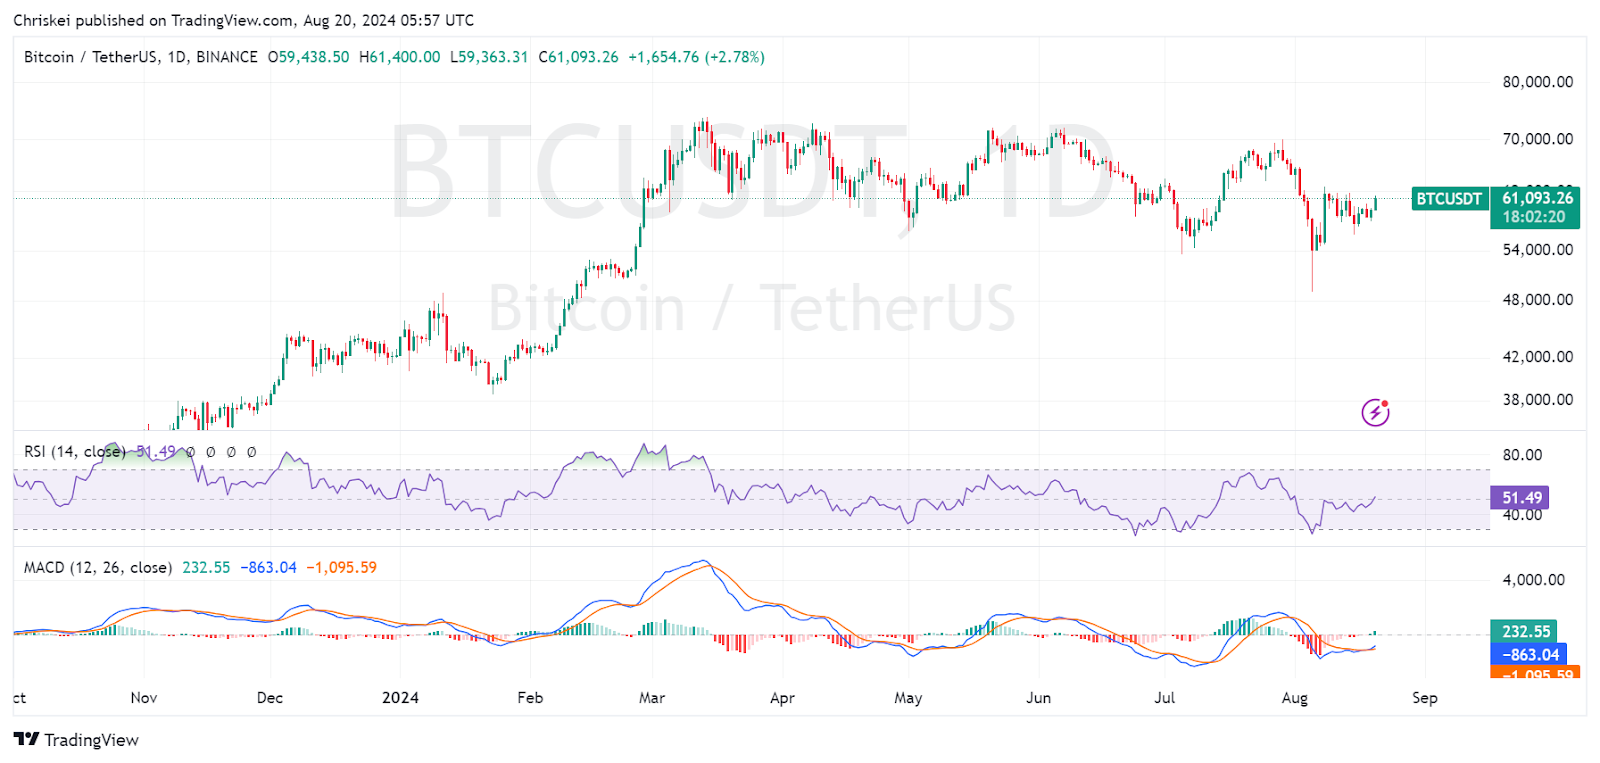
On the daily chart, the Relative Strength Index (RSI) is at 51.39, suggesting that Bitcoin is in neutral territory, neither overbought nor oversold. The Moving Average Convergence Divergence (MACD) indicator shows a slight bullish momentum, with the MACD line above the signal line, but the histogram indicates caution as it remains in negative territory. A clear break above the $60,000 mark could lead to strong upward momentum. On the other hand, failure to maintain this level might cause Bitcoin to retrace toward $56,000 or lower.


