


- Bitcoin faces resistance near $71,000-$72,000, key for potential bullish breakout.
- Strong support persists around $59,000-$60,000, critical for sustaining upward momentum.
- RSI stabilization below 50 hints at market sentiment shift, potentially favoring bullish scenarios.
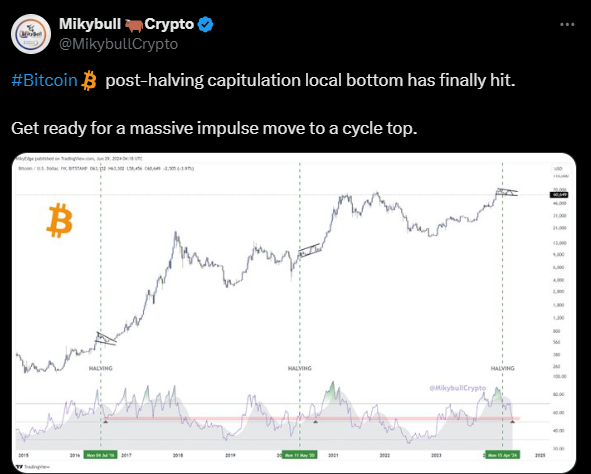
Bitcoin has recently navigated through a pivotal phase post-halving, marking what Mikybull Crypto, an analyst, believes to be a local bottom amidst a broader cycle. Analysts anticipate continued consolidation, with attention turning to potential opportunities in alternative cryptocurrencies which could outpace Bitcoin in returns.
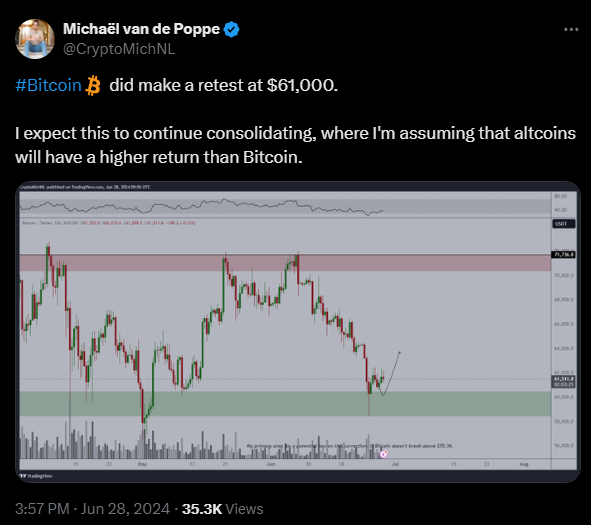
As highlighted by Michaël van de Poppe, CIO & Founder of MN Trading Consultancy, following a retest at $61,000, the cryptocurrency appears poised for significant movement, potentially leading towards a new cycle peak. Analyzing the 12-hour candlestick chart for Bitcoin against Tether (USDT) on KuCoin, key support and resistance levels emerge clearly.
A notable resistance zone spans from $71,000 to $72,000, where Bitcoin has encountered formidable selling pressure in previous attempts to breach this level. Conversely, a robust support zone lies between $59,000 and $60,000, demonstrating repeated instances of price rebounding from these levels.
Bitcoin hovers around $61,511.8, having recently rebounded from the lower bound of the support zone around $59,000. This bounce suggests ongoing validity of the support level, reinforcing bullish sentiment. The chart indicates a potential bullish reversal pattern, highlighted by an upward arrow targeting the $64,000 mark.
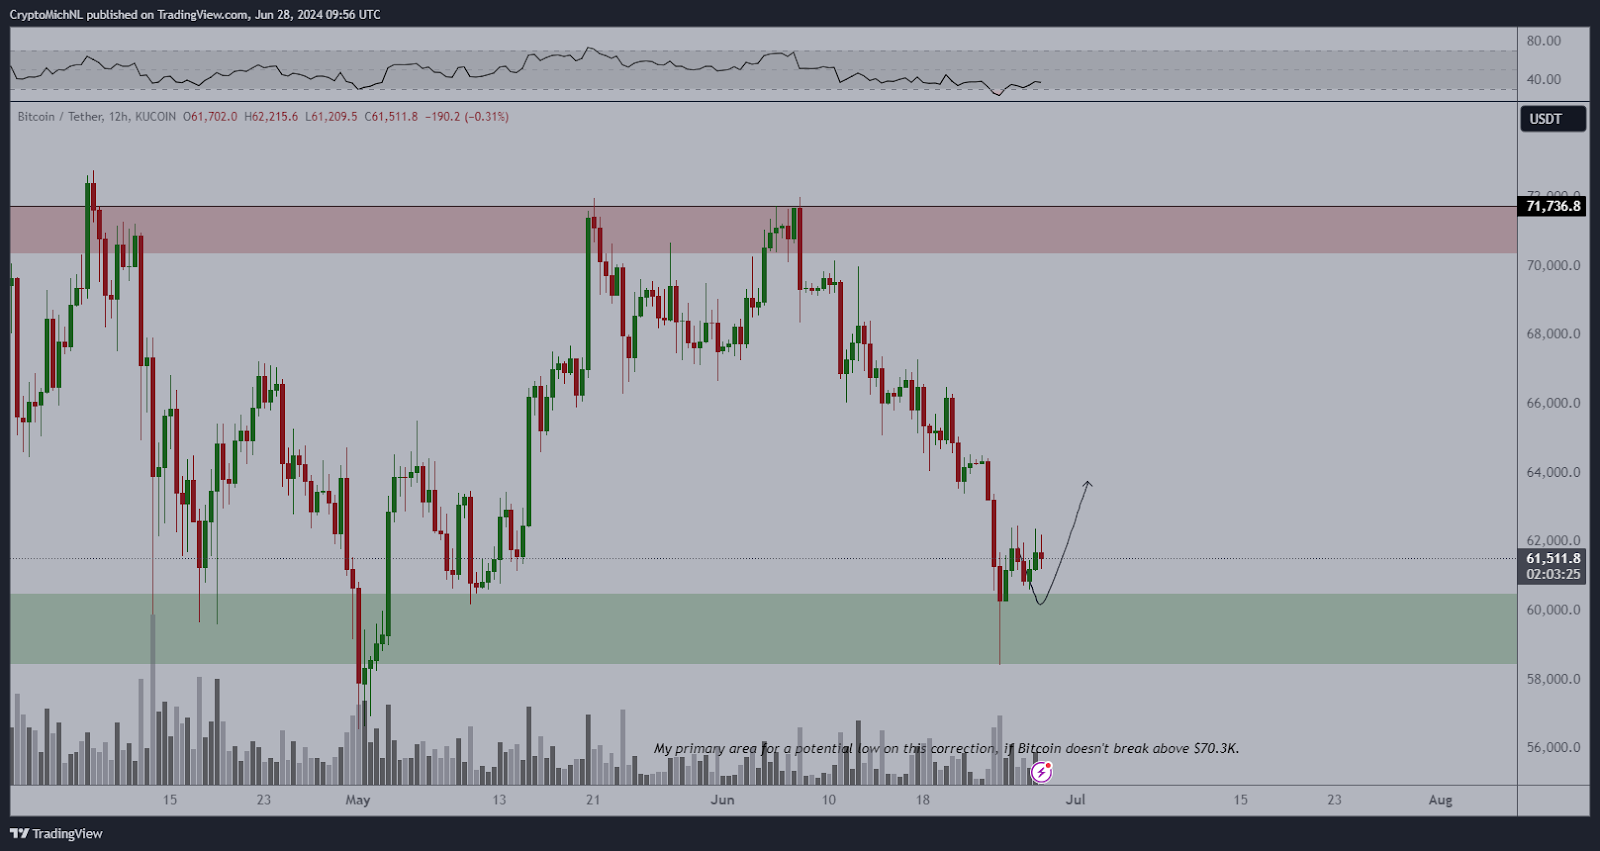
The Relative Strength Index (RSI), positioned above the chart, currently registers below the pivotal 50 level, indicating prevailing bearish sentiment in the market. However, signs of stabilization are evident as the RSI flattens, hinting at a possible shift towards bullish momentum.
EMA Level Signals Bullish Rally for SHIB and BTCIn the realm of potential scenarios, a bullish outlook emerges if Bitcoin maintains its position above the $59,000-$60,000 support zone and successfully breaches interim resistance around $64,000. Such a scenario could pave the way for a retest of the major resistance zone at $71,000-$72,000. Conversely, failure to sustain above the support zone may trigger further downside, potentially seeking lower support thresholds.
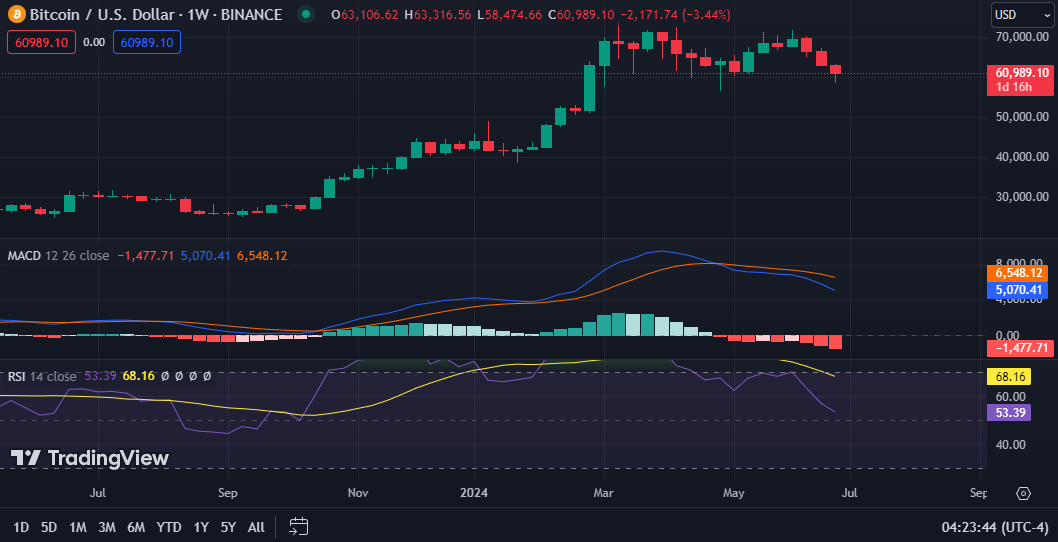
Bitcoin’s price of $61,014.93 at press time reflects a slight decline of 0.65% over the last 24 hours. The weekly RSI reading of 53.54 suggests Bitcoin is neither overbought nor oversold in the short term, indicating a balanced market sentiment. Meanwhile, the MACD indicator, trading below the signal line, hints at a possible bearish trend formation.


