- XRP shows potential for an upward move, supported by Elliott Wave patterns and RSI indicators.
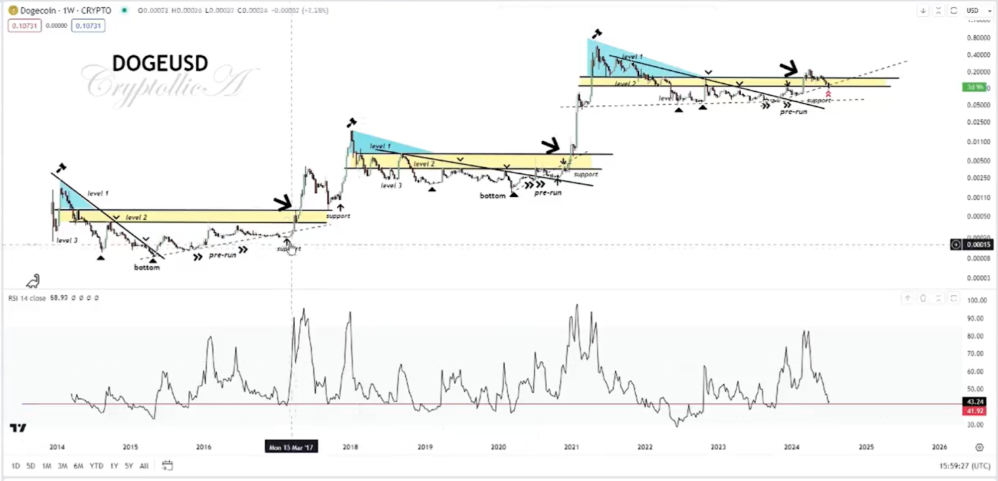
- DOGE is in an accumulation phase with significant upside potential if historical patterns repeat.
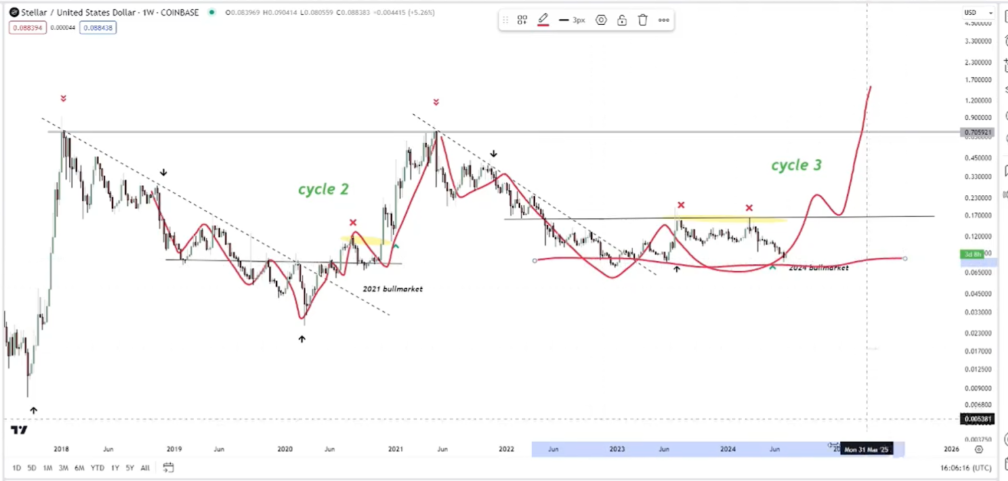
- XLM might be entering a new bull cycle, with technical indicators pointing to a bullish trend.
The cryptocurrency market is showing signs of bullish trends for XRP, DOGE and XLM based on recent technical analysis by Cryptollica. Each of these digital assets demonstrates patterns and indicators suggesting potential upward movements. The analysis incorporates Elliott Wave theory, RSI (Relative Strength Index) levels, historical performance and various chart patterns, offering insights into possible future movements.
For XRP, the chart analysis indicates a completed Elliott Wave cycle and the potential start of a new cycle. The historical peaks correlate with RSI oversold conditions. Currently, the RSI level shows a dip, suggesting an accumulation phase. This phase typically precedes a significant upward movement.

The long-term trendlines form a symmetrical triangle pattern, with breakout points from previous patterns showing substantial price increases. The key support level is around $0.3, with resistance noted at approximately $0.7. This setup indicates a possible bullish trend if the price breaks through the symmetrical triangle.
DOGE’s technical analysis reveals a multi-level pattern with three distinct levels of price accumulation and breakouts. The historical accumulation levels and subsequent breakouts are clearly marked. The current price action suggests that DOGE is in another accumulation phase. If this phase resolves upwards, it could lead to a significant price rise.

The measured move from previous patterns supports this potential upside. Support for DOGE is highlighted around the $0.07 level, with potential resistance near $0.14. These indicators suggest that DOGE might follow its historical patterns and see a substantial price increase.
Binance Moves 52 Million XRP to Unknown Wallet as Analysts Eye Key SupportXLM’s cycle chart outlines distinct phases of accumulation, breakout and consolidation. The chart identifies three cycles, with the current phase possibly entering a new bull market. Each cycle ends with a significant price rise. If this pattern repeats, XLM could see another major upward movement.

Breakout points are marked, correlating with Mayer Multiple Bands, which indicate potential price targets. Additionally, the RSI shows oversold conditions, which historically precede significant upward price movements. This combination of factors suggests a bullish outlook for XLM.
The technical analysis for XRP, DOGE and XLM indicates potential bullish trends based on historical patterns and current indicators. These insights provide a foundation for understanding possible future movements in the cryptocurrency market.


