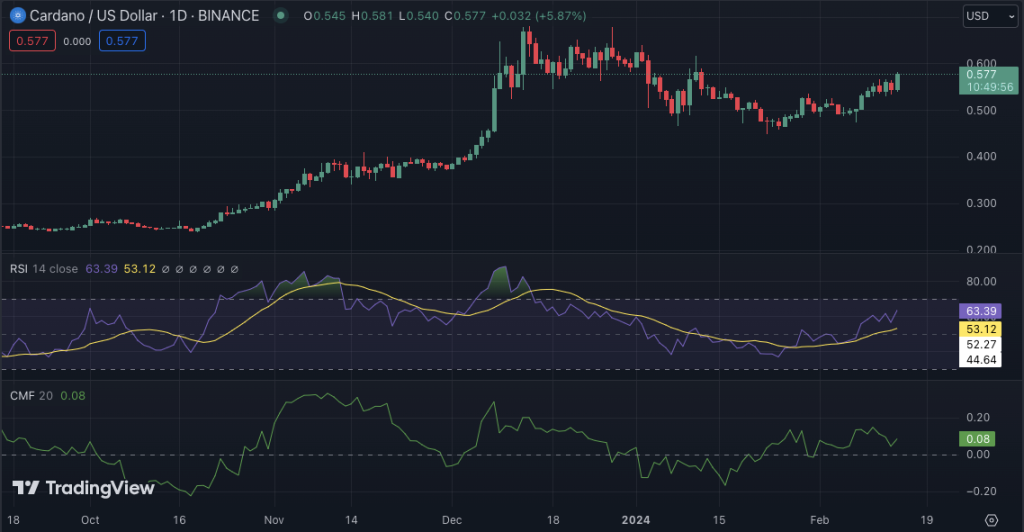
- Cardano’s impressive weekly gain of over 20% reflects its growing appeal in the crypto market.
- The Cardano price potential to hit the $0.80 mark depends on maintaining its bullish momentum.
- The Technical indicators show a cautiously optimistic outlook for Cardano’s price trajectory.
Cardano (ADA) is increasingly capturing the attention of both investors and developers as a leading project in the cryptocurrency sector. Notably, ADA has experienced a significant uptick in its value, propelled by the broader crypto market’s positive momentum, especially with Bitcoin breaking past the $51k mark.
Cardano’s value has seen an impressive climb over the last day, signaling a strong buying trend. Currently, ADA is trading at $0.5763, marking a 4% increase within 24 hours and a remarkable weekly gain exceeding 20%. This surge has boosted its market capitalization to $20 billion, securing its position among the top ten digital currencies.
Despite trading below the $1 threshold since April 2022, Cardano has recently shown signs of breaking out from this prolonged discount period. Its price fluctuation between $0.55 and $0.57 over the past week, with a notable push above the $0.55 mark, suggests growing bullish sentiment. Analysts from CryptoCapo believe that if this momentum continues, ADA could reach the $0.80 resistance level soon.
However, the journey for ADA might not be entirely smooth. If the market fails to gather enough support, ADA’s price could retreat to the $0.5 support level or, in a more bearish scenario, drop to $0.45.
Despite these potential setbacks, the overall market indicators for Cardano remain optimistic. The coin’s recent performance, breaking past key moving averages, hints at a strong buying interest ready to challenge the recent high of $0.7000. ADA’s transition from lower highs to a higher low pattern underscores its burgeoning strength and the possibility of significant price movements ahead.

The daily technical indicators for ADA indicate that the market exhibits a bullish sentiment. The Relative Strength Index (RSI) stands at 63, indicating a neutral market without a clear bullish bias. Meanwhile, the Moving Average Convergence Divergence (MACD) shows a slightly bullish trend, with the MACD line crossing above the signal line. The Chaikin Money Flow (CMF) indicator is positive at 0.8, indicating buying pressure in the market.


