
- Cardano’s falling wedge pattern suggests a possible 40-50% price surge upon a confirmed breakout.
- A close above the descending channel’s upper trend line with strong volume signals a bullish reversal for ADA.
- ADA’s RSI near oversold territory hints at decreasing selling pressure, setting up for a potential price rebound.
Cardano (ADA) is on the brink of a significant technical breakout that could result in a notable price surge. Currently, ADA is trading at $0.396236, with a 24-hour trading volume of $329,496,296. The price has increased by 2.17% in the last 24 hours, suggesting a growing interest in the cryptocurrency. Technical indicators and chart patterns hint at a potential bullish reversal, making this an exciting time for traders and investors.
The 1-day timeframe chart reveals a falling wedge pattern, a classic bullish signal. As highlighted by ZAYK Charts, an analyst, a breakout from this pattern could propel the price upwards by 40-50%.
Moreover, ADA is moving within a descending channel, characterized by lower highs and lower lows. This bearish pattern indicates a continuing downtrend unless a breakout occurs. However, recent price action suggests that ADA might be gearing up for such a breakout.
The lower trend line of the descending channel has served as a strong support level. This line has been respected multiple times, providing a robust base for potential price rebounds.
Cardano (ADA) Nears Pivotal Reversal, Signals Potential Bullish SurgeConversely, the upper trend line of the channel acts as the key resistance level. A close above this line, accompanied by strong trading volume, would likely confirm a bullish breakout. This move would signify a reversal from the current downtrend and could trigger substantial upward momentum.
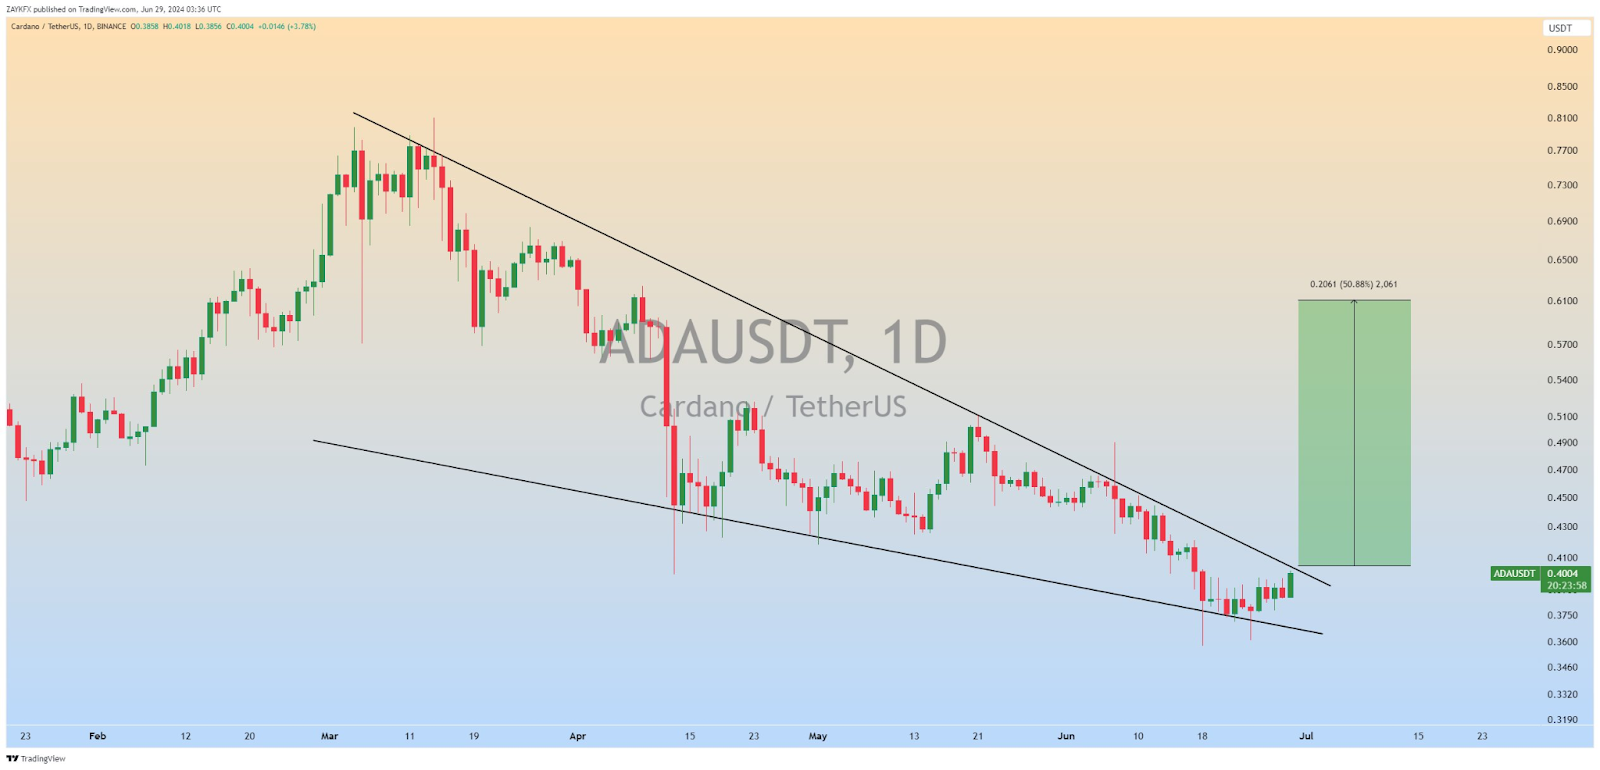
The breakout potential is further supported by ADA’s recent price movements. If the price closes above the upper trend line with significant volume, it could signal a bullish breakout. This would open the door to a potential 50.88% price increase, targeting the $0.60 level. This target is derived from the height of the descending channel projected from the breakout point. Such a move would mark a significant milestone for ADA, given the current market conditions.
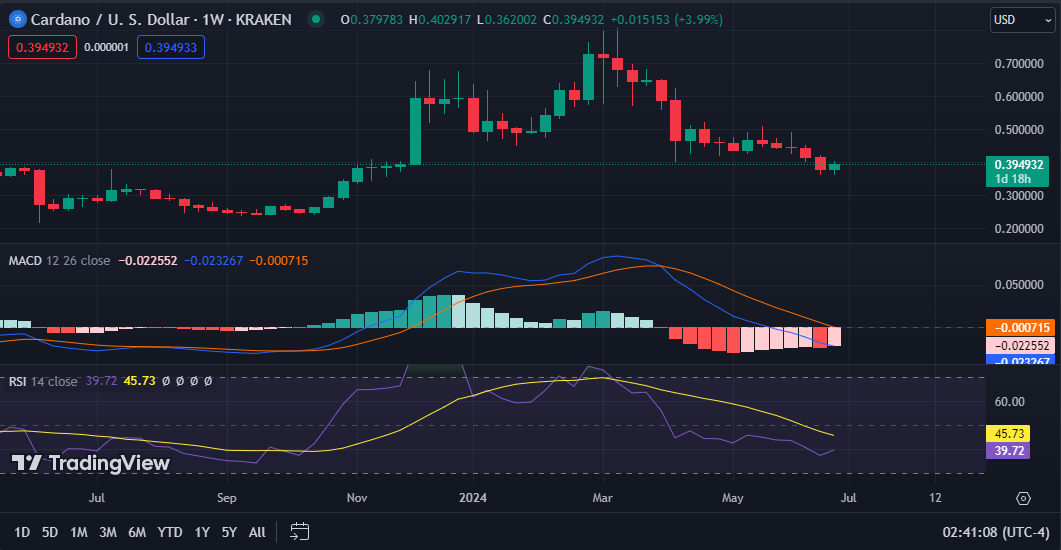
Additionally, the Relative Strength Index (RSI) on the 1-week chart reads 39.57, indicating that ADA is approaching oversold conditions. This suggests that the selling pressure might be waning, setting the stage for a potential price rebound. The Moving Average Convergence Divergence (MACD) indicator, however, shows that the MACD line is trading below the signal line, hinting at possible downward momentum in the near term.