
- Cardano’s breakout above key resistance at $0.4250 signals potential for a 45.48% gain towards $0.52-$0.58.
- ADA’s ability to hold above $0.40 and $0.3240 support levels will be crucial amid ongoing bullish momentum.
- A neutral RSI at 44.77 indicates that ADA is poised for potential upward movement despite short-term MACD caution.
Cardano ($ADA) has made headlines with a significant trend line breakout on the daily timeframe, signaling a possible bullish rally as highlighted by Clifton Fx, an analyst. The chart analysis for ADA reveals key insights and potential price movements for this cryptocurrency. This recent breakout could indicate a shift in market sentiment, promising an exciting phase for investors.

The downtrend for Cardano began around mid-April and continued for several months. However, the price has now broken above this downtrend line, suggesting a potential reversal. This breakout is a crucial development, hinting at a change in the prevailing bearish sentiment. The price is currently trading around $0.4250, a notable resistance level.
Analyst Highlights A Bullish Turnaround in Cardano PricesIf ADA manages to sustain above this level, it could target the $0.52-$0.58 range, representing a potential gain of approximately 45.48% from the current breakout point. This range is marked by a green rectangle on the chart, indicating a significant resistance zone.
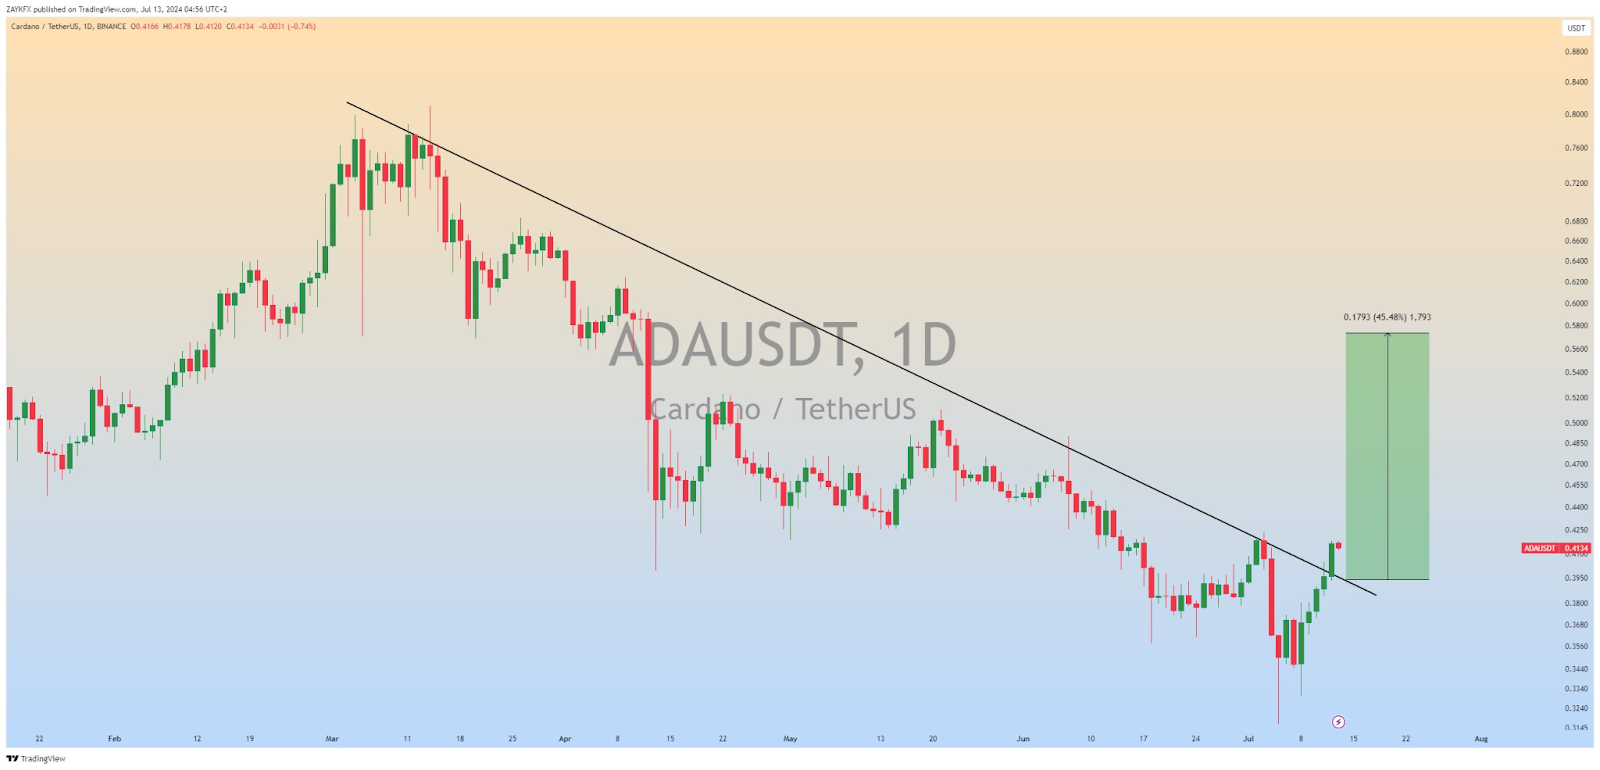
On the downside, immediate support is now at the downtrend line, which has turned into a support level of around $0.40. This support is crucial for maintaining the bullish outlook.
Additionally, another support level can be observed at around $0.3240, the recent low before the price started to recover. These support levels are vital for investors to watch, as a failure to hold above them might see the price retracing to these lower levels.
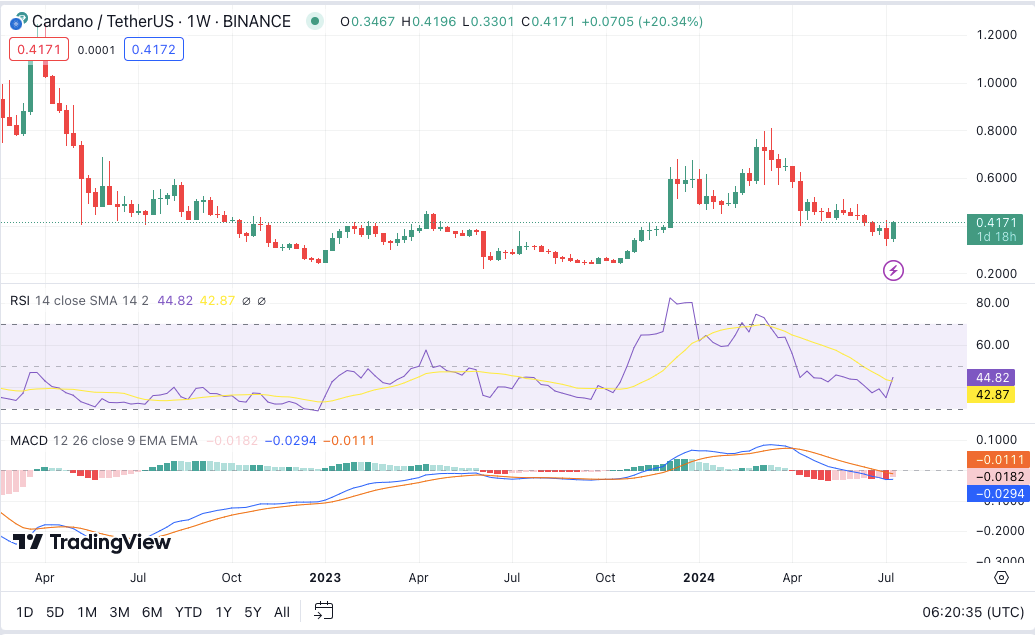
Currently, Cardano is trading at $0.414302, with a 24-hour trading volume of $322,298,474. The cryptocurrency has witnessed a 4.23% increase in the last 24 hours. The 1-week Relative Strength Index (RSI) reads 44.77, indicating that ADA is neither oversold nor overbought.
This neutral RSI suggests that there is room for upward movement without the immediate risk of a reversal. However, the 1-week Moving Average Convergence Divergence (MACD) is trading below the signal line, suggesting some short-term downward momentum.